

Wheat is the first among the worldŌĆÖs three most important staple crops - rice, wheat, and maize - being grown on over 215 million ha annually with a harvest of around 727.9 million tons and contributing nearly US $50 billion (FAO 2018/19) each year to global markets. Wheat crops are exposed to various biotic and abiotic stresses and their survival depends on proper management and/or genetic defense mechanisms against these stresses. Spot blotch disease of wheat is caused by Cochliobolus sativus. Drechsler ex Dastur (anamorph Bipolaris sorokiniana (Sacc.) Shoem.), a hemibiotrophic fungus, and constitutes a significant constraint of the crop in warm, humid, tropical areas of Bangladesh, Bolivia, Brazil, India, Nepal, and Paraguay (Gupta et al., 2018; Gurung et al., 2013; Singh et al., 2015). Spot blotch of wheat has been documented as causing yield losses ranging between 16 to 20% annually (Dubin and van Ginkel, 1991) and as high as 100% in severe epidemics (Mehta, 1998). Resistance to spot blotch is quantitative and involves three genes (Sb1, Sb2, Sb3) working in an additive manner (Gupta et al., 2018; Joshi et al., 2004). This type of spot blotch resistance slows the progress of the disease as a cumulative effect of the resistance genes (Eisa et al., 2013), but little has been known regarding the biochemical components involved (Yusuf et al., 2016).
Among the structural and biochemical resistance factors, lignin is the most important (Boudet, 2000) and lignification in cells plays a crucial role through programmed deposition around the pathogen penetration sites by creating a ring of lignified cells (Ca├▒o-Delgado et al., 2003; Tronchet et al., 2010). Being a primary defense molecules in plants against pathogens (Nicholson and Hammerschmidt, 1992), lignin makes the cell more rigid, resulting in resistant to mechanical pressure and chemical reaction applied by fungal pathogen during penetration (Bird and Ride 1981; Southerton and Deverall, 1990). These lignin depositions in wheat are not readily soluble and hence not digestible, thus creating a physical barrier against several pathogens (Bishop et al., 2002; Tronchet et al., 2010). Earlier studies also found that lignification around the infection site restricted the movement of water and nutrients to the fungus, retarding its growth (Elad and Evensen, 1995). Wheat cells use reactive oxygen species (ROS) as signal molecules that activate the primary and secondary metabolic pathways for lignin formation (Jacobo-Vel├Īzquez et al., 2015).
Various studies have reported the role of lignin in host-pathogen interactions (Bhuiyan et al., 2009; Bird and Ride, 1981; Miedes et al., 2014; Tronch et al., 2010), but few exist concerning the role of lignin on pathogen fitness. For this study we hypothesized that lignin affects pathogen fitness parameters such as latent period, lesion expansion and spore production, thereby slowing disease progress, and we looked infection-induced lignin production and its effect on pathogen fitness in association with free radicals produced during infection, with the ultimate aim of using this information to help characterize resistant genotypes.
Materials and Methods
Experimental design and wheat genotypes
The experiment was conducted using 29 bread wheat (Triticum aestivum L.) breeding lines (Table 1) developed by the International Maize and Wheat Improvement Center (CIMMYT) and selected from an original population of 968 genotypes known for resistance to spot blotch. To reduce confounding effects from differing plant height and days to maturity (Joshi et al., 2002), we chose lines with a maturity range of 6 days to heading and with a plant height range of 100-120 cm. The lines were sown in the second week of December to match the post-anthesis stages with warm temperatures during early February to early March, which are favorable for spot blotch (Joshi and Chand, 2002).
The experiment was carried out at the Agricultural Research Farm, Institute of Agricultural Sciences, Banaras Hindu University, Varanasi, India (NEPZ, 25.2┬░N, and 83.0┬░E) over two seasons, 2014-15 and 2015-16 on a field that had been used for rice-wheat cropping during the previous 10 years. Crop management comprised 120 kg N: 60 kg P2O5: 40 kg K2O per ha fertilization, using a full dose of P2O5 and K2O at sowing but Nitrogen as split, 1/2 at sowing and 1/4 after first (21 days) and second (40 days) irrigations, with a total of 5 irrigations.
We used a randomized block design with 2 rows of 1 m each for each genotype sown with a 25 cm spacing between rows and 15 plants per row.
Inoculation and disease assessment
Spores of the B. sorokiniana strain HD 3069 (MCC 1572) were produced by aseptic culturing on sorghum grain (Chand et al., 2013). The spore suspension of 104 spores/ml of sterile water aided with 100 ╬╝l Tween 20 was sprayed uniformly during evening hours at the half panicle emergence stage (ZGS 55, Zadoks et al., 1974) followed by light irrigation to maintain high humidity and night dew deposition for pathogenesis and disease development.
Ten plants of each line were randomly selected and tagged and disease progress (area under the disease progress curve, incubation period, latent period, lesion number, lesion size, spores/cm2 lesion) was recorded on the tagged plants.
To measure pathogen fitness, incubation period was recorded upon observing the first visual symptom of disease on more than 50% plants (Parlevliet, 1979), and data related to latent period was collected and computed according to Das et al. (1993):
Where F = final number of lesions, t1 = day before 50% lesions sporulated, t2 = day after 50% lesions sporulated, nt1 = number of lesions sporulated at t1, nt2 = number of lesions sporulated at t2.
The relative rate of resistance for the latent period, sporulation, AUDPC, and fitness index of the pathogen was calculated according to Willocquet et al. (2017):
Where LPS and LPX are the latent periods for the genotype
The same formula was used to calculate the relative rate of resistance to spore production, fitness index, and AUDPC, where LPS and LPX are the latent periods measured for the genotype to be characterized by susceptible control genotype CIANO T79.
To measure lesion size and number of lesions/cm2, 10 flag leaves per replication of tagged plants in each row were photographed using a Nikon D5200 (Nikon, Tokyo, Japan) digital camera and the images were examined in Adobe Photoshop using an analysis plug in to quantify lesion sizes and numbers on individual leaves.
The disease was scored visually when all lines showed symptoms. AUDPC was calculated based on disease severity at GS63, GS69, and GS77 as outlined by Shaner and Finney (1977):
Where yi is an assessment of disease at the ith observation, ti is time (in days) at the ith observation, and n is the total number of observations.
Assessment of lignin and reactive oxygen species Raising of lines and sampling
All 29 genotypes evaluated under field conditions were planted in pots under a poly-house and inoculated using a mono-conidial isolate of B. sorokiniana strain HD 3069 (MCC 1572). We maintained a temperature of 24 ┬▒ 2┬░C and a relative humidity Ōēź 80% using fogging. Flag leaves were collected before and after inoculation of the pathogen at four different times (0, 3, 7 and 14 DAI) from tagged plants. For ROS, flag leaves were excised, immediately cooled in liquid nitrogen and stored at ŌłÆ80┬░C for further assays. For lignin estimation two flag leaves/genotypes were collected in paper envelops and were oven dried for overnight at 60┬░C.
Assay of reactive oxygen species and lignin
H2O2 was estimated according to Patterson et al. (1984). Leaf samples (200 mg) were homogenized in a sodium-phosphate buffer (5 mM, pH 6.5) and the extract centrifuged at 10,000 ├Ś g for 15 min. The reaction was initiated by adding TiSO4 (HiMedia, India GRM2484) (1% in 20% H2SO4) to the supernatant. The reaction mixture was again centrifuged at 10,000 ├Ś g for 15 min and absorbance recorded at ╬╗ 410 nm on Double Beam UV-VIS Spectrophotometers (ELICO, Hyderabad, India SL196). The quantity of H2O2 was expressed as ╬╝M per gram fresh weight using an extinction coefficient of 53.5714.
Superoxide radicals (O2ŌłÆ) were estimated according to Misra and Fridovich (1972). The reaction mixture contained 20 ╬╝M of sodium-phosphate buffer (pH 7), 20 ╬╝M NADH (AMRESCO, India, Product code: 0384), 100 ╬╝M disodium EDTA and 1.2 mM epinephrine (Sigma, Missouri, US E4642). Change in the absorbance was noted at ╬╗ 480 nm for 10 min.
The protocol of Halliwell et al. (1987) was used to measure hydroxyl radicals (OHŌłÆ). 100 mg of fresh leaf sample was homogenized into 2 ml of 50 mM sodium-phosphate buffer (pH 7) and centrifuged at 22,000 ├Ś g for 15 minutes at 4┬░C. The reaction mixture contained 1 ml of supernatant, 0.8 ml of 2.5 mM 2-deoxyribose and 200 ╬╝l of 2 mM FeSO4 incubated in the dark for one hour. TBA (0.25% in 10% of TCA) was added, reaction mixture boiled at 80┬░C for 20 minutes and immediately cooled. The whole reaction mixture was then centrifuged at 3,000 ├Ś g for 10 min, and absorbance noted at ╬╗ 352 nm.
Lignin was quantified as per Aldaeus (2011). A 100 mg oven-dried sample was digested in 75% sulphuric acid by incubation in a water bath at 35┬░C for 1 h, followed by autoclaving at 121┬░C for 1 h. The solution was filtered through pre-weighed WhatmanŌĆÖs filter paper (Grade 01). The filtrate was used to measure soluble acid lignin (ALS), and residue over filter paper was used for quantification of insoluble acid residue.
The total lignin was calculated by following formulae:
a) Acid-insoluble residue (AIR) = (m/M) ├Ś 1,000 mg/g,
b) Acid soluble lignin (ASl) = ((A.D.V) / (a.b.M)) ├Ś 1,000 mg/g,
c) Total lignin content = AIR + ASL
Where m = the residue after drying in g, M = Oven-dry weight of sample before acid hydrolysis/suspension, in g, A = Absorption at 205 nm, D = Dilution factor, V = Volume of the filtrate, in l, a = Extinction coefficient of lignin, in g/l cm (here: 110 g/l cm, according to TAPPI UM 250), b = cuvette path length, in cm (here: 1 cm), M = Weight of sample (as 100% dry matter) before acid hydrolysis/suspension, in g
Histo-pathological assay and histochemical staining
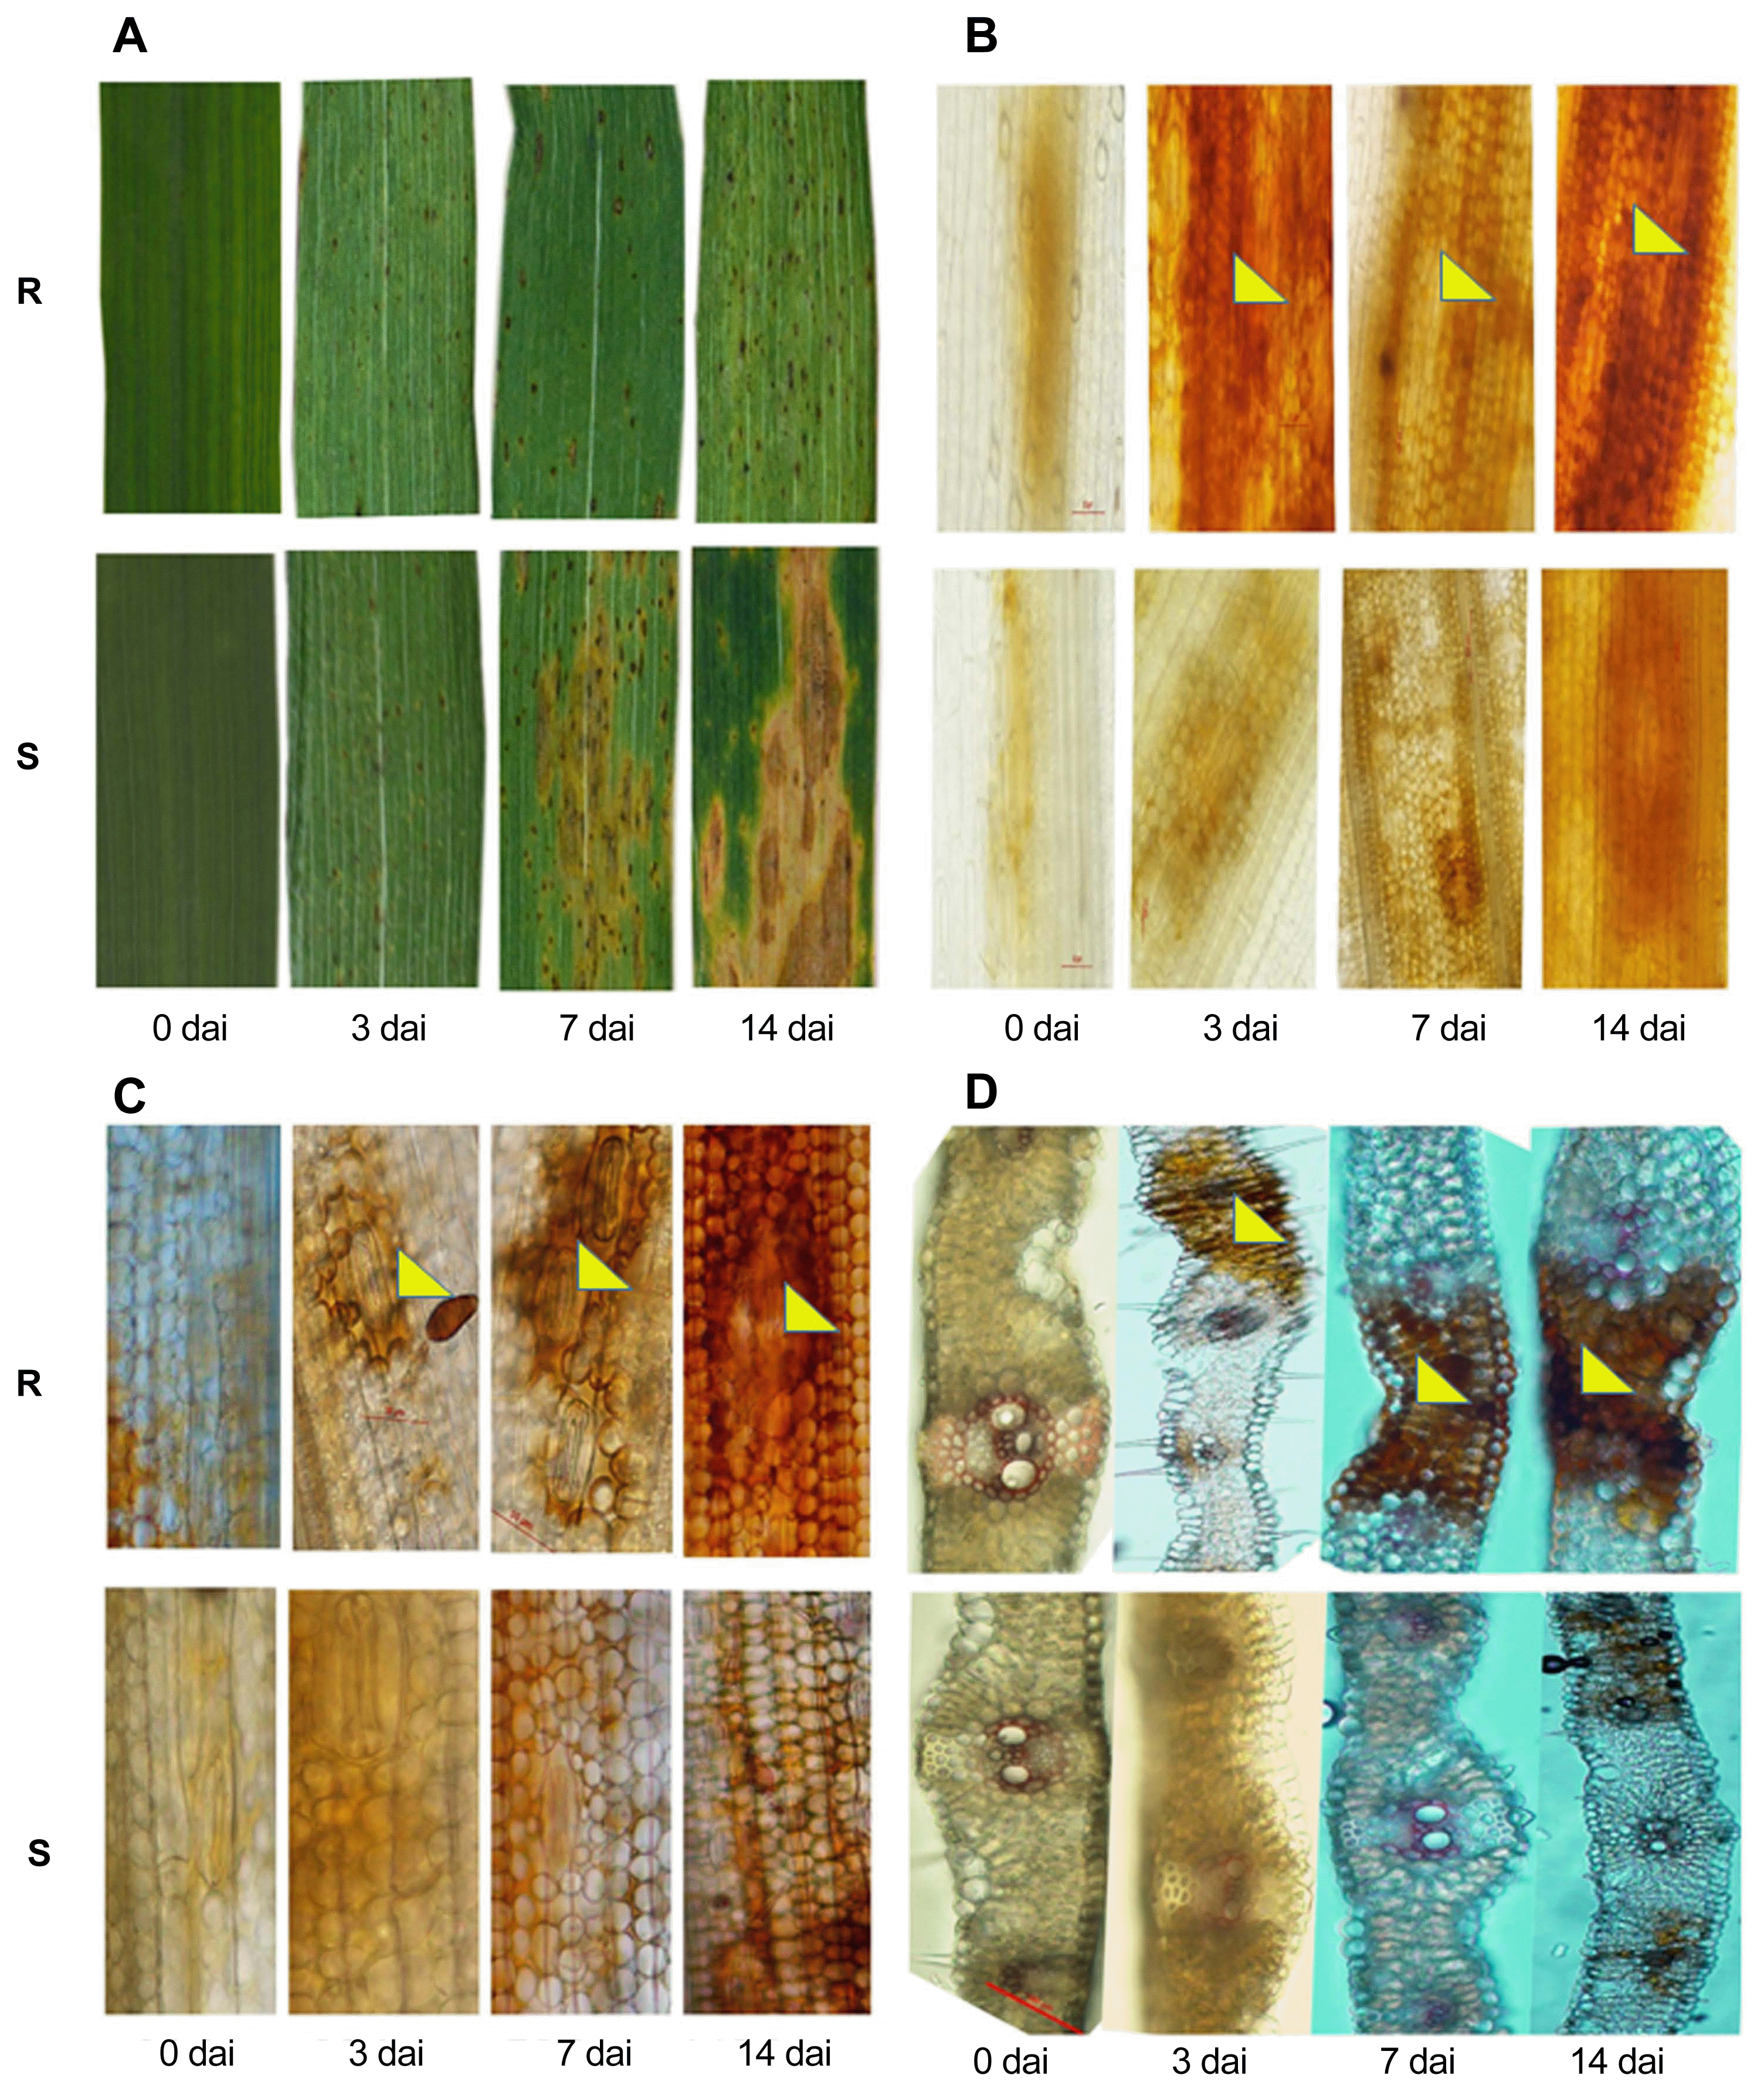
Staining for lignin deposition was done using a phloroglucinol- HCl (Wiesner) test (Beardmore et al., 1983). Flag leaves were taken from tagged plants. Infected leaves and disease free leaf segments were soaked in a 10% w/v phloroglucinol solution in 95% ethanol for 3 min, drained and placed in a drop of 10 M HCl on a slide, covered with a thin glass sheet, sealed with paraffin and observed for a purple-red vein as an indicator of lignin. The localization of H2O2 generation in leaf samples was done using 3, 3ŌĆ▓-diaminobenzidine (DAB, Sigma, Missouri, US) staining (Thordal-Christensen et al., 1997). Three leaf segments of 1 cm2 from 5 tagged plants were collected and submerged in a solution containing 5 ml of DAB stain (1,000 ╬╝l/ml). The tubes were placed on a standard laboratory electrical shaker for 7-8 h to allow the uptake of DAB and its reaction with H2O2 at 80-100 rpm. After leaves were stained, DAB was replaced by a bleaching solution (ethanol: acetic acid: glycerol = 3:1:1) and the tubes placed carefully in boiling water (90-95┬░C) for 15 min to bleach out the chlorophyll. After 15 min of boiling, the bleaching solution was replaced by a fresh bleaching solution and allowed to stand for 30 min. DAB and lignin stained infected tissues were examined and photographed of using a Nikon Eclipse E200 microscope (Nikon, Tokyo, Japan). The development of appressoria and the colonization of host tissue by the pathogen were assessed by sampling inoculated leaves at 24, 48, 72, 96 hpi. The number of appressoria, number of penetrating pegs and distortion of appressoria if any were noted under the microscope, using the methodology of Sillero and Rubiales (2002).
Statistical analysis
Statistical analyses were performed using SAS (version 9.2; SAS Institute Cary, NC, USA). Data were first tested using the Shapiro and Wilkes (1965) test for normality and the homogeneity of variance among the groups determined by using the Levene test (Levene, 1960). Pooled data of two years were subjected for variance analysis in a general linear model using the PROC GLM procedure. Correlation, clustering, and principal component analysis were done using the PROC CORR, PROC CLUSTER and PROC VARCLUS procedures of SAS 9.2 (SAS Institute, Cary, NC). BonferroniŌĆÖs adjustments at P = 0.05 were used to compare pairs of treatment means.
Results
Phenotypic variation and response of genotypes to B. sorokiniana
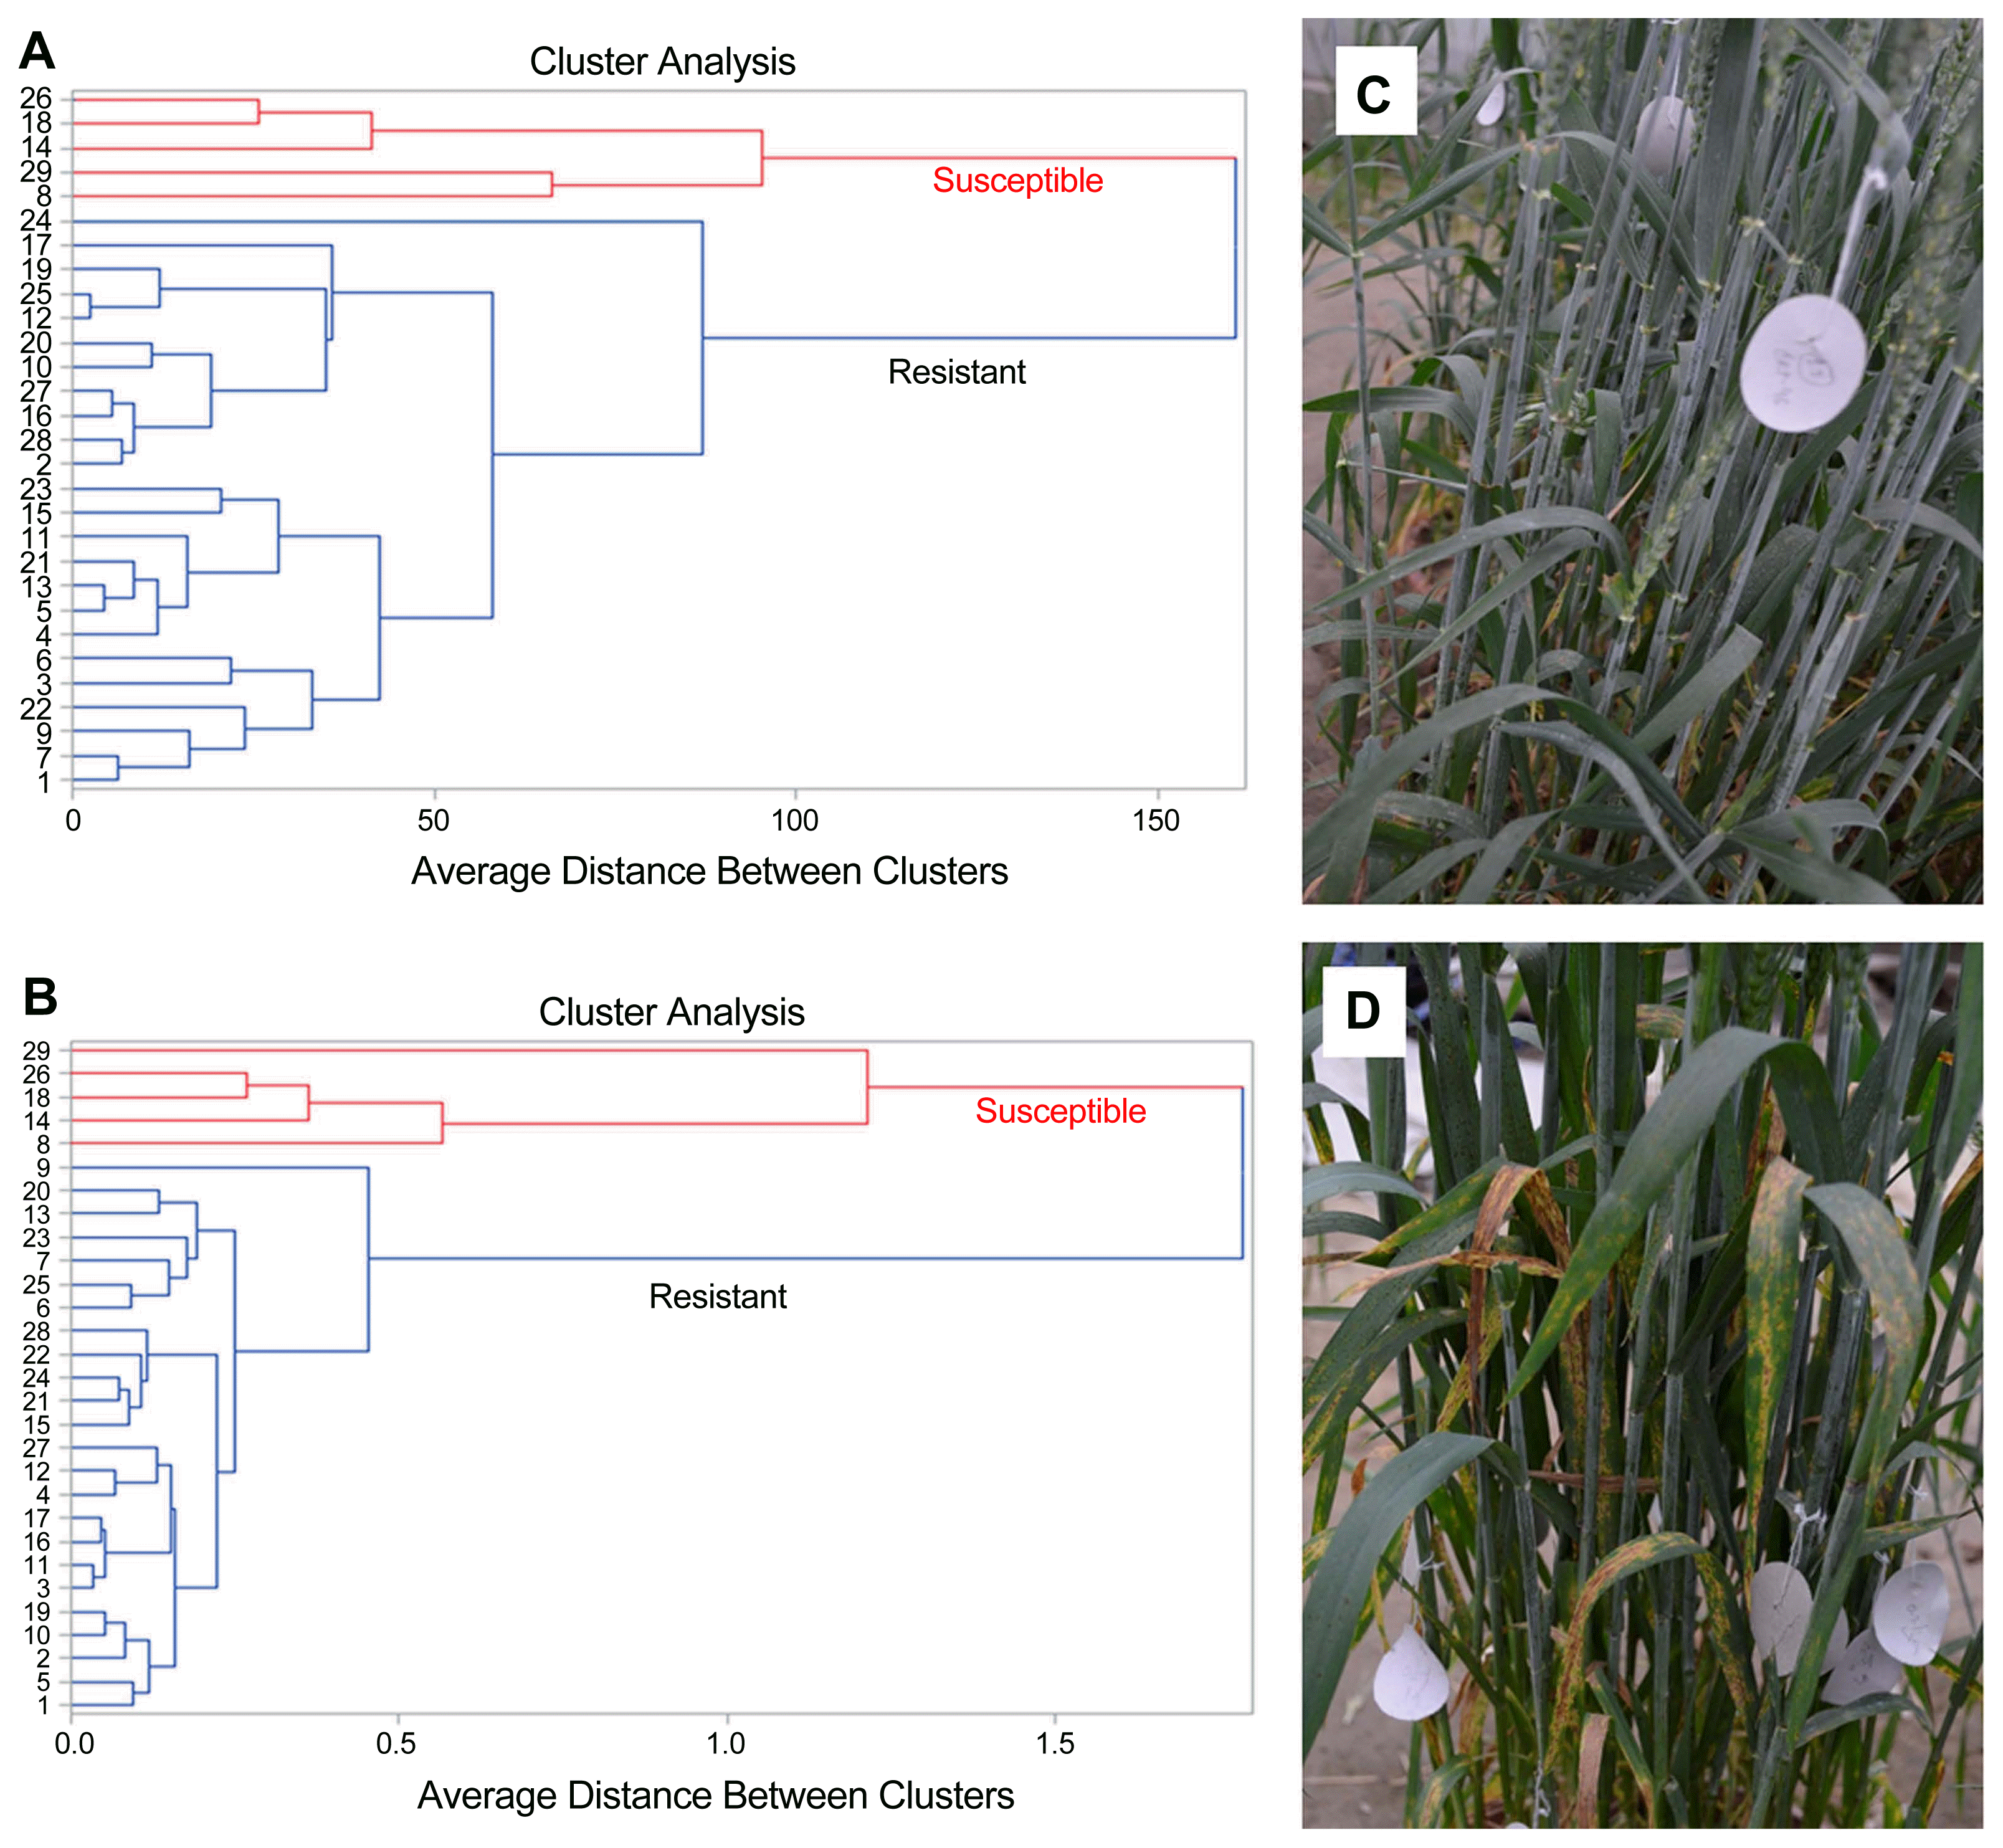
Cluster analysis of 29 genotypes based on 12 phenotypic parameters, lignin content and free radical production in response to B. sorokiniana infection separated them into two groups (Fig. 1A and B). Five susceptible genotypes (8, 14, 18, 26 and 29) formed a single clade (Fig. 1A) while the remaining (20) resistant genotypes formed another clade (Fig. 1B) and clustered into the second group. The typical resistant and susceptible responses to B. sorokiniana are depicted in Fig. 1C and D. The combined ANOVA (Supplementary Table 1) indicated significant differences in phenotypic traits for the year, genotype and year ├Ś genotype.
The mean phenotypic character values for two independent experiments are presented in Table 2. In susceptible genotypes, AUDPC and other disease components such as lesion area, spores/cm2, spore germination percentage, number of appressoria, percent penetrating appressoria were the highest, whereas yield components (biomass, plot yield, and thousand kernel weight) were lowest (Table 1).
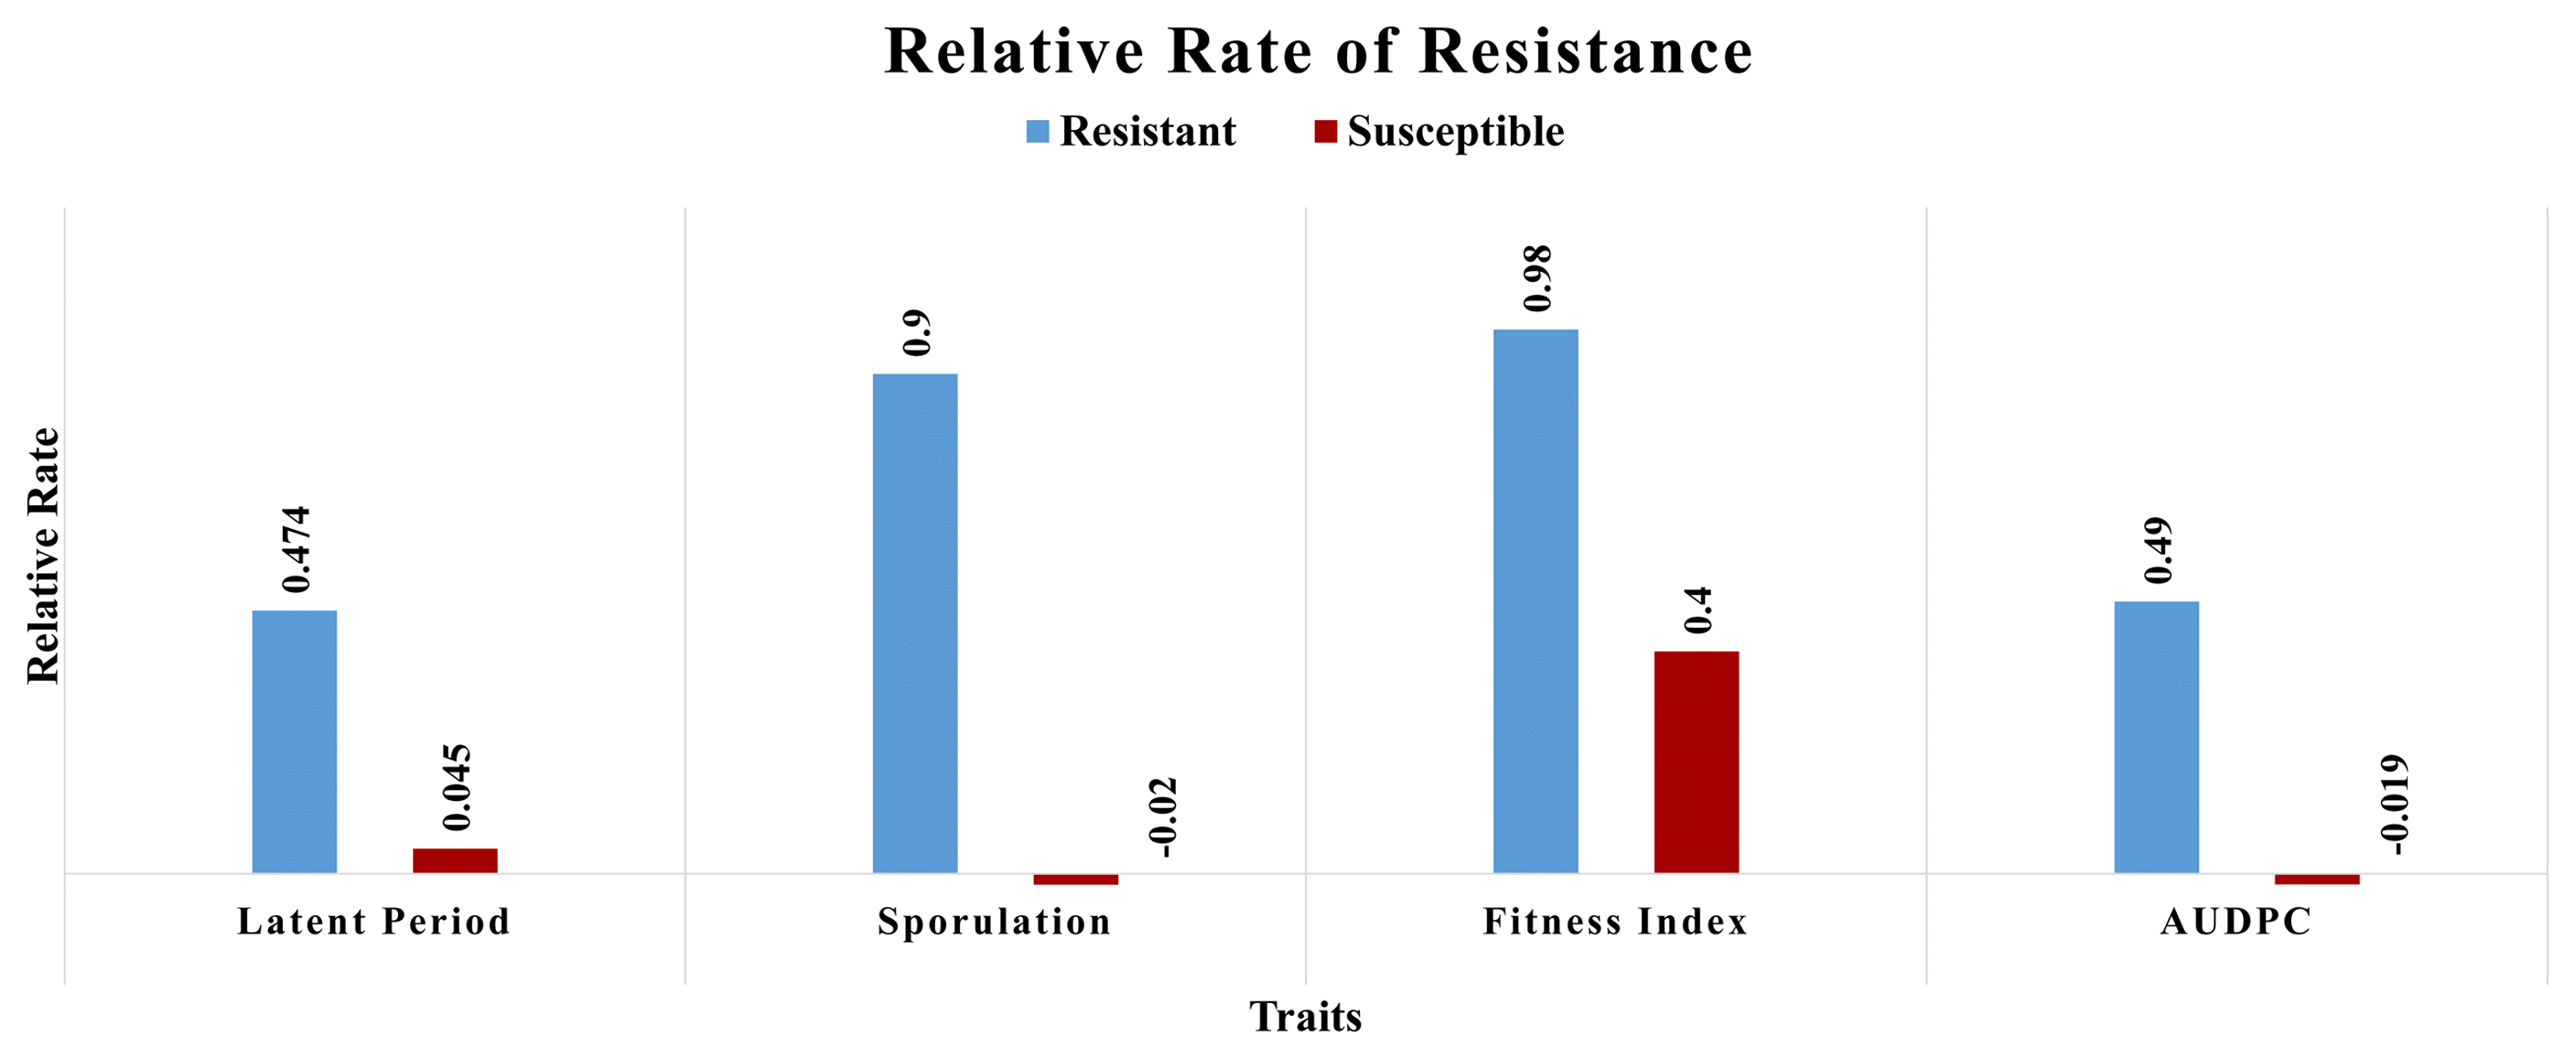
The relative rate resistance for the latent period, sporulation, AUDPC, and fitness index of pathogen
The relative rate of resistance measures the ability of a genotype to counter pathogen infection cycles. In our study, the lignin accumulation directly affected the pathogen latent period and spore production, implying reduced fitness and slower disease progress. The relative rate of resistance for sporulation, latent period, and AUDPC and the host fitness index were higher in resistant genotypes than susceptible ones. (Table 2, Fig. 2). These results were confirmed in the histopathological analysis, wherein ROS associated lignin production significantly reduced the number of aspersoria and of direct penetration pegs in resistant genotypes (Table 2).
Correlations between fitness parameters and disease associated traits
The estimates of linear correlation coefficients (Table 3) showed that AUDPC was positively and significantly correlated with lesion area and sporulating lesions whereas significantly and negatively correlated with lesion number, latent period, maturity duration, biomass, thousand kernel weight (TKW), plot yield, and lignin content. Lesion number was positively and significantly associated with the latent period and lignin content, but negatively with lesion area and sporulating lesions. These and other correlations appear in Table 3.
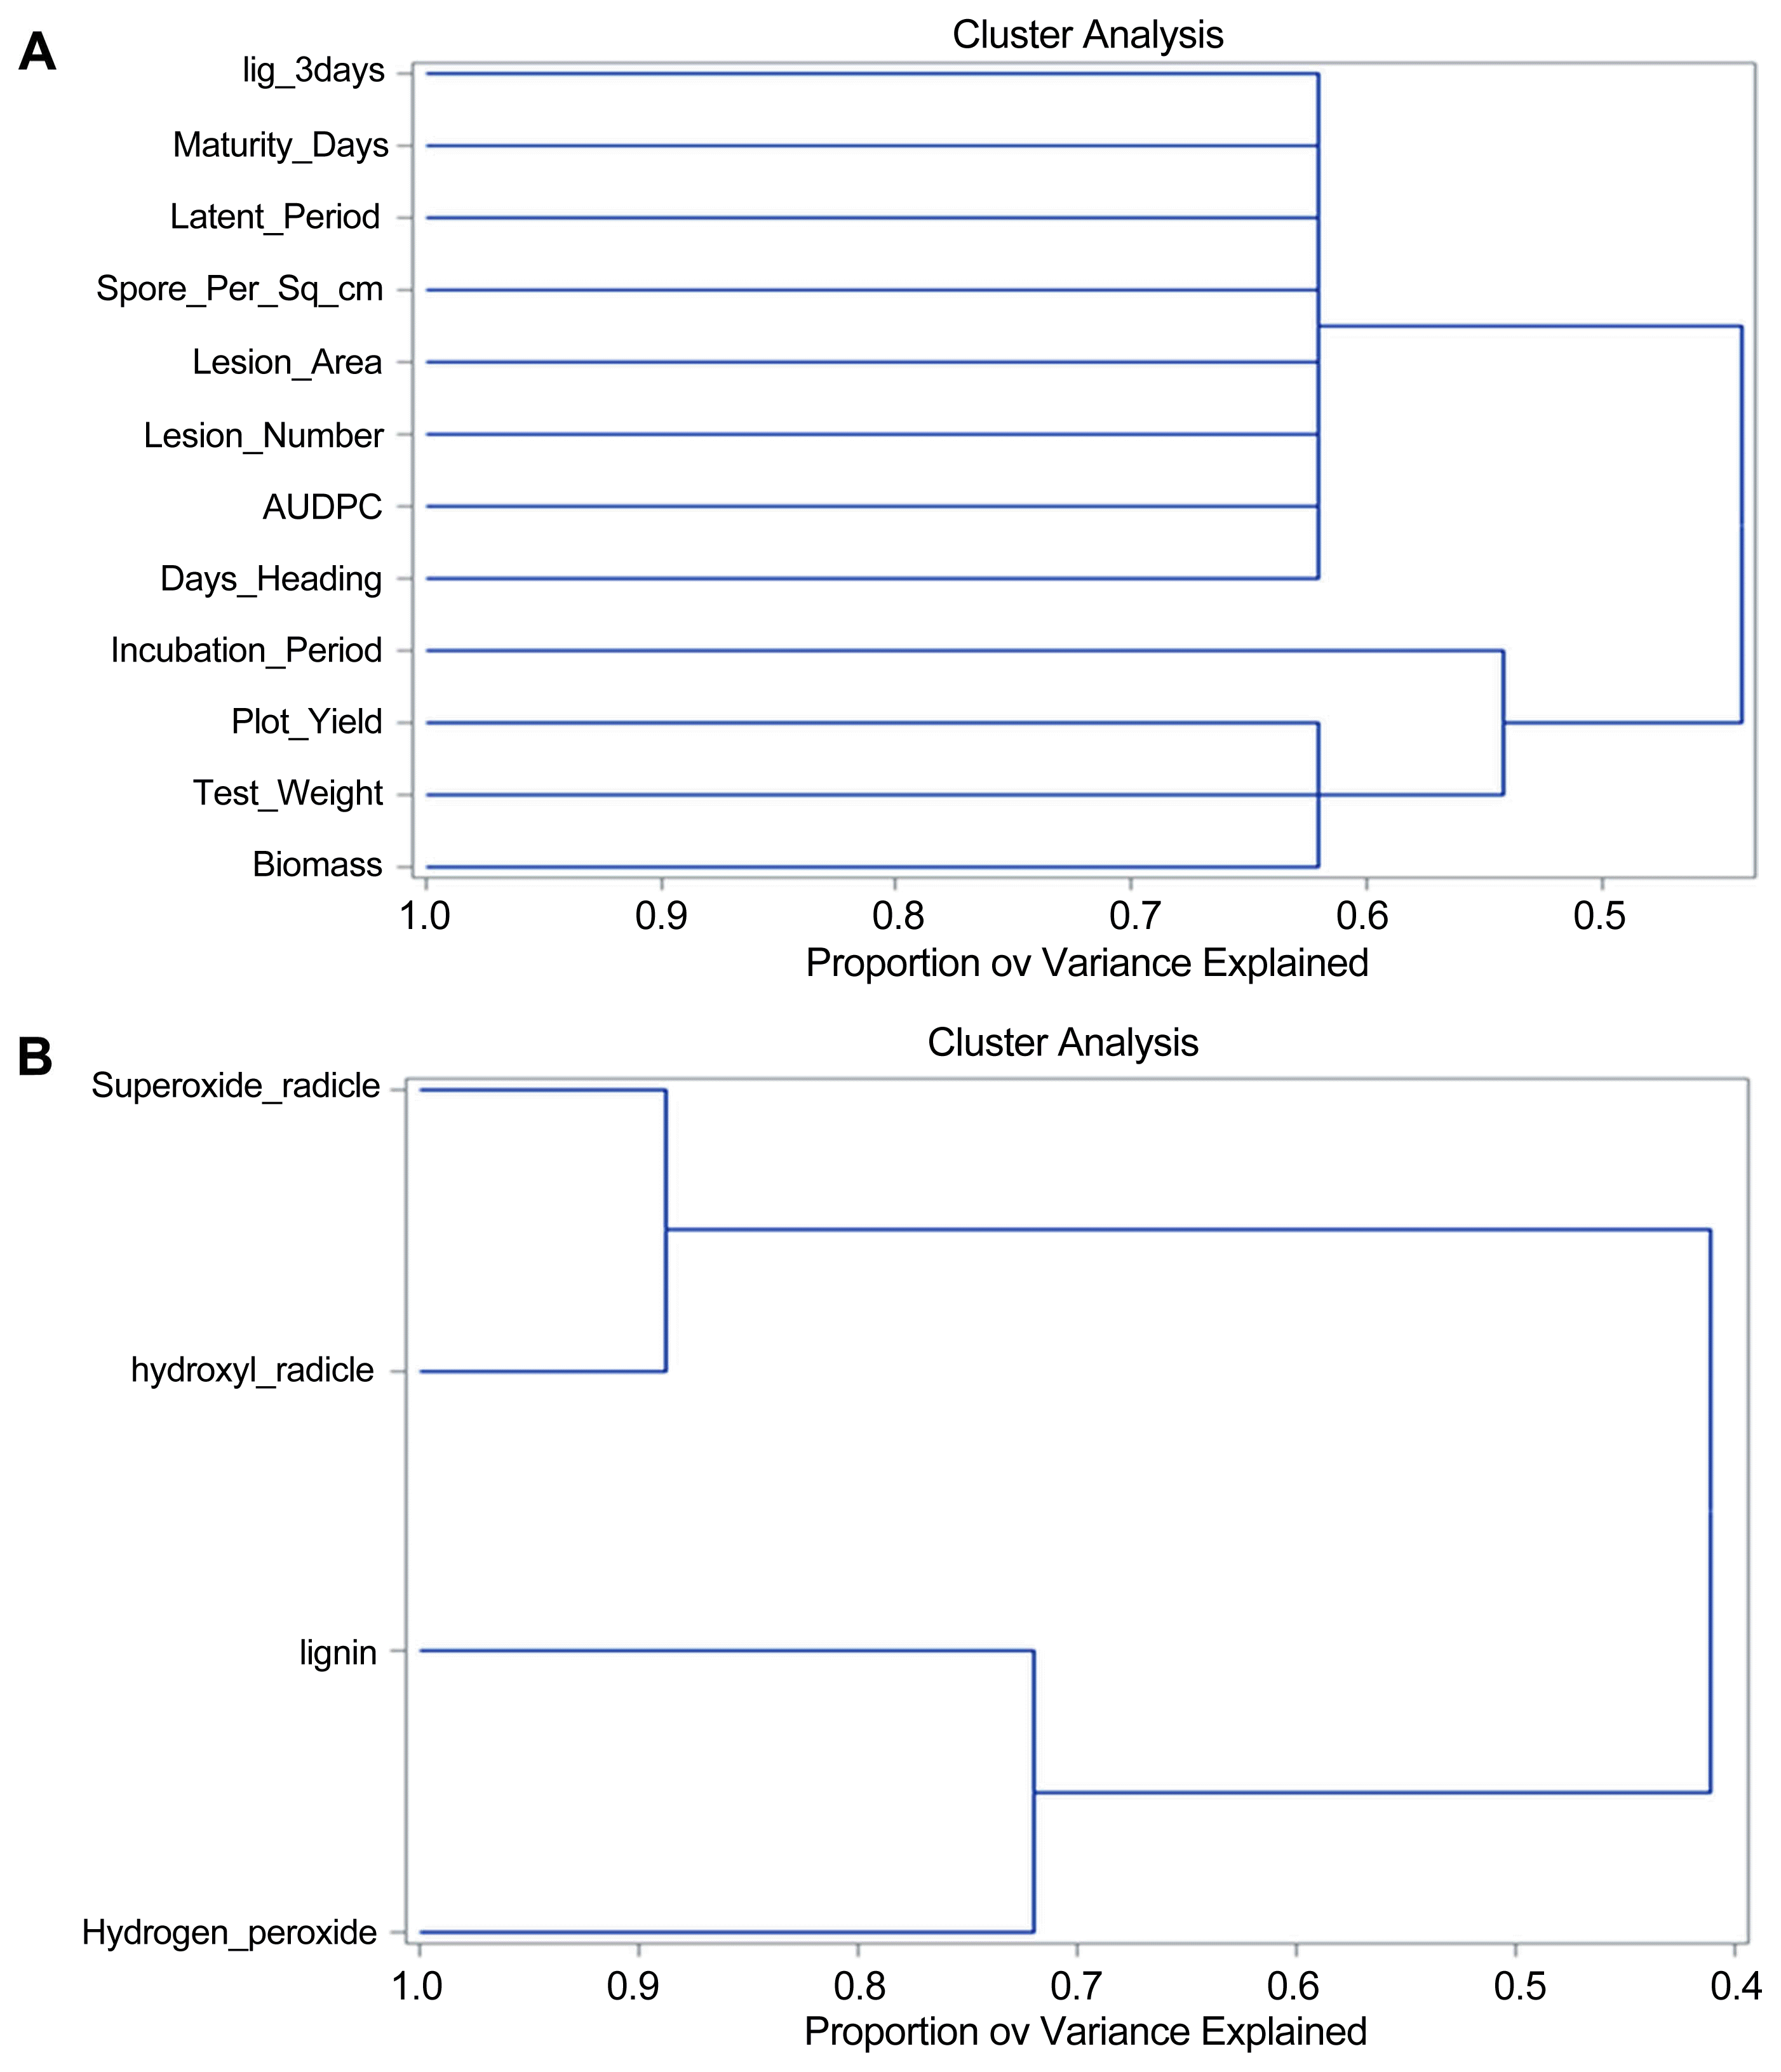
All traits separated into two clusters (Fig. 3A); cluster 1 includes AUDPC, days to heading, lesion area, lesion number, spores per cm2, latent period, maturity duration and lignin content that explains maximum variation (Supplementary Table 2). The yield components plot yield, test weight and biomass clustered in another separate cluster indicating the adverse effect of the disease on yield components.
Biochemical studies
The combined ANOVA (Supplementary Table 1) showed a significant difference for year, treatment, time and interaction for different biochemical components. We found significant variation for biochemical factors in wheat genotypes. The interactions year ├Ś time, time ├Ś genotype year ├Ś genotype were also significant for all biochemical components and LIG. The interaction year ├Ś time ├Ś genotypes was significant only for H2O2, OHŌłÆ, and O2ŌłÆ.
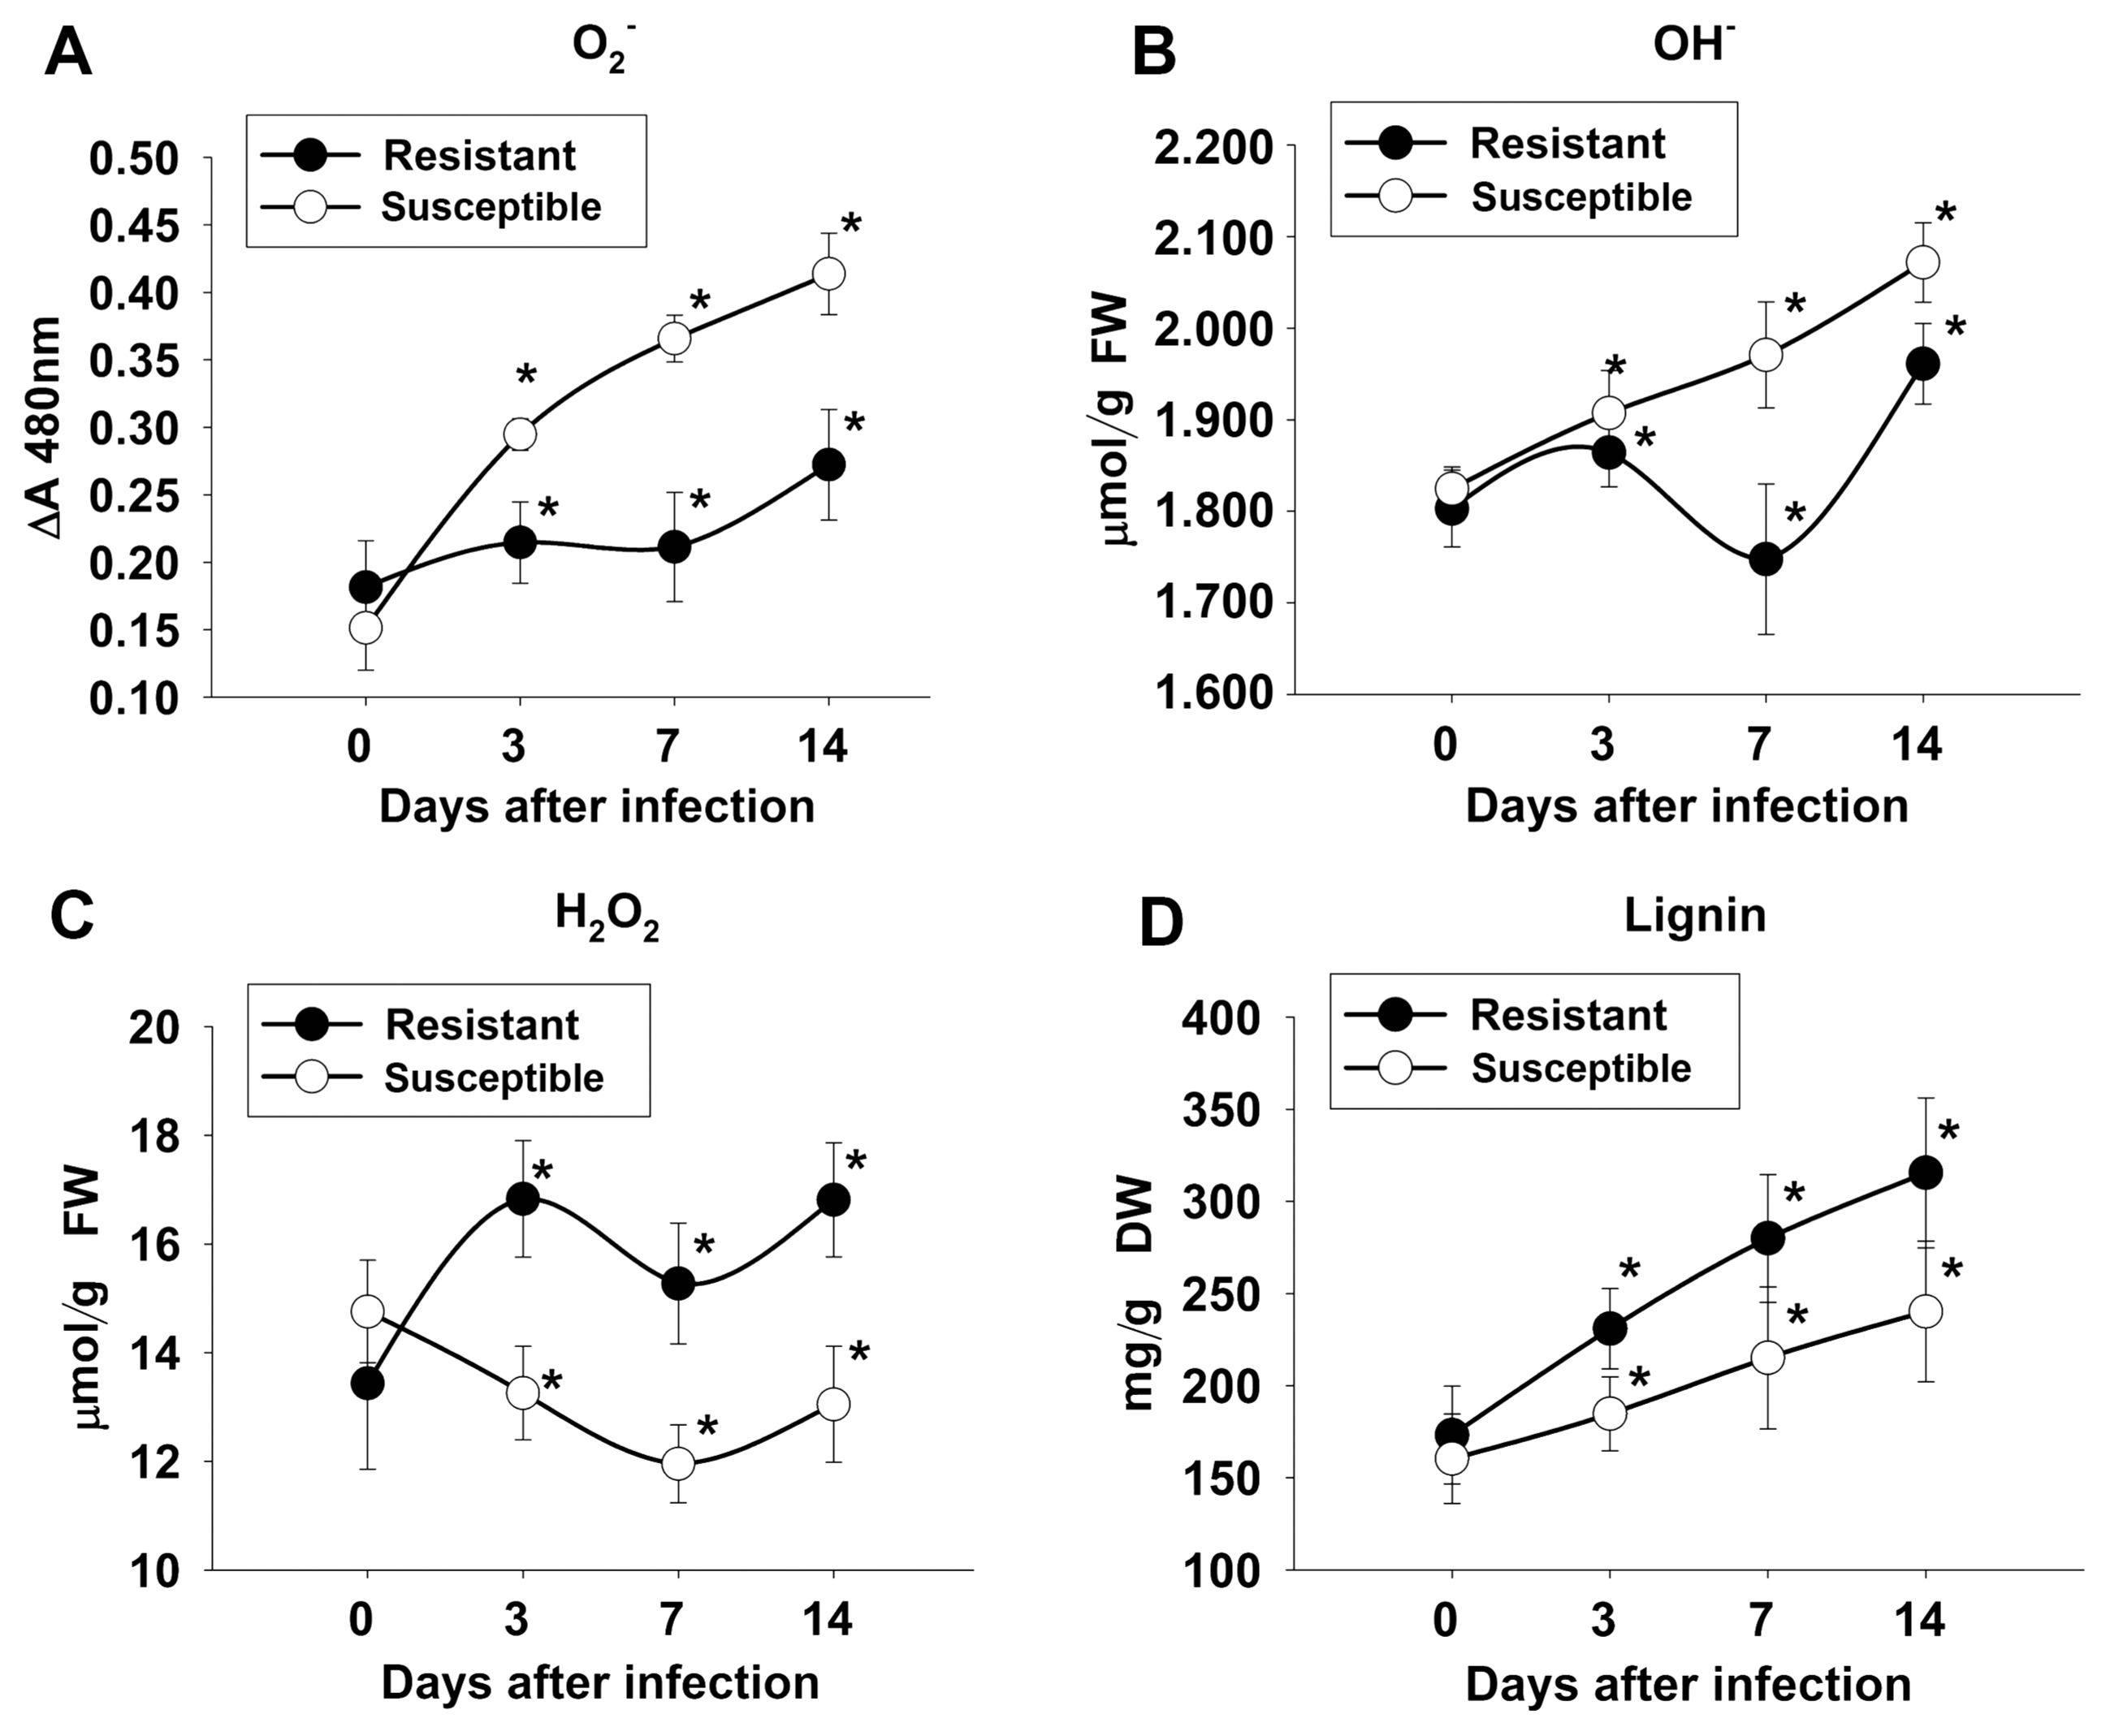
The mean values of all the biochemical traits (O2ŌłÆ, OHŌłÆ, H2O2, and LIG) at different times for 29 wheat genotypes in response to flag leaf infection with B. sorokiniana are shown in Supplementary Table 4-7 and in Supplementary Fig. 1-4. Higher O2ŌłÆ and OHŌłÆ, lower H2O2 and LIG were observed in genotypes 8, 14, 18, 26 and 31; likewise, lower O2ŌłÆ and OHŌłÆ, higher H2O2 and lignin appeared in the remaining lines. At 0 DAI (before inoculation), there was no significant difference in biochemical content between resistant and susceptible genotypes. The activity of O2ŌłÆ (Fig. 4A) was elevated at 3 DAI and continuously increased to 7 and 14 DAI in susceptible genotypes. In resistant genotypes, O2ŌłÆ had increased slightly by 3 DAI and reached a maximum at 14 DAI. The continuous increase in OHŌłÆ (Fig. 4B) was also observed in susceptible genotypes at all times but was elevated at 3 DAI, reduced at 7 DAI and reached a maximum at 14 DAI, in resistant genotypes. Likewise, H2O2 increased at 3 DAI, decreased in 7 DAI, and became elevated at 14 DAI in resistant genotypes (Fig. 4C). In susceptible genotypes, H2O2 continuously decreased up to 7 DAI and began increasing at 14 DAI. Lignin (Fig. 4D) continuously increased in both susceptible and resistant genotypes but fold change was significantly higher in resistant genotypes.
DAB and phloroglucinol-HCl staining of resistant and susceptible genotypes for H2O2 and lignin are shown in Fig. 5B and C. There was no significant difference in lignin deposition between susceptible and resistant genotypes at 0 DAI, but after infection lignin deposition increased rapidly in resistant genotypes. Susceptible genotypes also showed less lignification around penetration points, whereas higher lignification around the penetration points, restricting the pathogen, was observed in remaining genotypes. Coalescing lesions appeared in susceptible genotypes, while restricted spots were observed in resistant ones.
Correlation among the free radicals and lignin associated with resistance and susceptibility to B. sorokiniana
Estimates of the correlation coefficients among the three free radicals (O2ŌłÆ, OHŌłÆ, and H2O2) and lignin at different time points are shown in Table 4. No significant correlation between free radicals and lignin was observed before inoculation (0 DAI) except for OHŌłÆ which was significantly and negatively correlated with O2ŌłÆ in three measurements (3 DAI, 7 DAI, and 14 DAI). There was a significant positive correlation between OŌłÆ and O2ŌłÆ. Likewise, OHŌłÆ was significantly and negatively correlated with H2O2 and lignin at 7 DAI and 14 DAI. On the other hand, H2O2 was significantly and positively correlated with lignin at 3DAI and 7 DAI but negatively with OHŌĆóŌłÆ at 7DAI and 14 DAI and with O2ŌłÆ at 3DAI, 7DAI, and 14 DAI. Likewise, O2ŌłÆ was significantly and negatively correlated with lignin at 3, 7 and 14 DAI.
Results of the variable cluster analysis indicate the positive regulation of hydrogen peroxide on lignin content, clustering them together (Fig. 3B), whereas the hydroxyl and superoxide radicals appear in a different cluster, that explains maximum of variation (Supplementary Table 3 and 4). From this clustering, it is evident that hydrogen peroxide level is positively correlated with lignin formation but not with superoxide or hydroxyl radicals.
Discussion
We observed that susceptible genotypes showed lower expression of H2O2 ROS, resulting in lower lignification at the site of infection, probably leading to higher expressions of lesion area, AUDPC and the number of spores cmŌłÆ2 lesion but lower lesion numbers and shorter latent periods. These also associated with the variable growth and development of the pathogen (Yusuf et al., 2016). Fast pathogen growth and reproduction accelerated its spread, fostering quick coverage of green area, with significantly reduced biomass and grain yield.
On the contrary, resistant lines recorded higher H2O2 activity and lignification at penetration and colonization sites, restricting individual lesions and with no or delayed coalesce, resulting in low AUDPCs and more extended latent periods. The pathogen reproduces only after attaining the critical biomass, which is possible only after colonization of sizable amounts of tissue. Higher lignin production at the site of colonization of host tissue interferes with pathogen development, keeping it below critical levels, so most small lesions had no spores, in our study. Lignification-based protection resulted in higher biomass and grain yield, as the AUDPC directly depends on the spread of disease in leaves (Bashyal et al., 2011), reducing green leaf area and grain filling (Bingham et al., 2009).
The rapid development of disease in a crop largely depends on the amount of secondary inoculum that often appears with a short latent period and increased infection efficiency in the pathogen (Tomerlin et al., 1983). Milus and Line (1980) established a negative correlation of latent period with uredia/cm2 of the leaf surface, for Puccinia recondita in wheat. We found similar results, wherein genotypes with a shorter latent period showed a larger lesion area, a higher number of spores/lesion, and higher AUDPC. These components were retarded in resistant genotypes. Thus, these traits can be considered predictors of resistance. However, there was no significant difference for incubation period between susceptible and resistant genotypes, indicating that resistance is expressed at the post penetration stage of the pathogen.
Relative resistance is another component of resistance, represented by the efficiencies of monocyclic infections in host-plant genotypes with respect to susceptible controls. Quantitative resistance involves many important phenotypic and biochemical factors, including lignification in wheat - B. sorokiniana interactions, which play vital roles in the elucidation of defense responses (Joshi et al., 2004; Sharma et al., 2018). The relative rate of resistance predicts the efficiency of a genotype to sustain the polycyclic form of the disease. For air-dispersed fungi, components of disease such as infection efficiency, latent period, sporulation intensity, lesion expansion, and infectious period has highest impact on epidemics and may be considered as a priority in phenotyping for resistant genotypes. We observed that resistant genotypes significantly reduce the sporulation fitness index, latent period and AUDPC, indicating their ability to sustain grain production under infections involving multiple reproductive cycles of the pathogen.
Lignification as a defence response was seen to be three times greater in resistant wheat genotypes than in susceptible ones, under Karnal bunt infections (Purwar et al., 2012). Eisa et al. (2013) observed a similar role for higher lignification as a barrier to penetration, in spot blotch resistant lines. The concentration of lignin in this study reduced disease expression, resulting in smaller, restricted, non-sporulating lesions, in resistant genotypes. These visual quantitative traits will help wheat breeders to select for resistance in the field experiments.
Significant variation in lignin content among resistant genotypes and its production at the site of infection in our study indicates the scope for selection for higher lignin content in advanced breeding lines. The biosynthesis of lignin begins with the formation of glycosylated monolignols from the L-phenylalanine through general phenylpropanoid and monolignol-specific pathways (Boerjan et al., 2003). Whereas, L-Phenylalanine is derived from the shikimate biosynthetic pathway in the plastid (Dixon et al., 2001) and needs various signals to induce lignification. Among the signaling molecules ROS is reported (Denness et al., 2011). In this study there was no significant difference in O2ŌłÆ, OHŌłÆ, and H2O2 before inoculation in resistant and susceptible genotypes, indicating a balanced production, utilization, and scavenging of ROS, under unstressed conditions. After inoculation with B. sorokiniana, O2ŌłÆ and OHŌłÆ levels increased gradually in susceptible genotypes but not resistant ones, in which it eventually started decreasing as the genotypes appeared to balance the oxidative stress by the production of antioxidants such as superoxide dismutase and catalases involved in scavenging free radicals (Lightfoot et al., 2017). This finding supports the idea that resistant genotypes are more successful at detoxifying O2ŌłÆ into less harmful substances such as H2O2, as part of the resistance response. The increasing ROS in both susceptible and resistant genotypes at 14 DAI might reflect senescence leading to an oxidative burst that produces the superoxide radical and hydrogen peroxide and results in accumulation of the hydroxyl radical (Apel and Hirt, 2004; Hakmaoui et al., 2012).
The role of H2O2 in wheat defense against Septoria tritici infection has been demonstrated by infection being accompanied by a massive and early H2O2 accumulation during incompatible interactions, which did not occur during compatible interactions, where there was very little H2O2 accumulation and hyphae were able to grow in the host apoplast after stomatal penetration. Our results also showed a positive correlation between H2O2 production and lignin content after inoculation. In resistant genotypes, the amount of lignin and H2O2 production was higher while the opposite happened in the susceptible. In transgenic potato H2O2, mediated lignification of the cell wall enhanced disease resistance (Wu et al., 1997). The higher H2O2 produced in resistant genotypes might have been used to synthesize the lignin polymer, with a small amount remaining available to repair cell damage. H2O2 has been shown to be necessary for the polymerization of cinnamyl alcohols, an essential enzyme in lignin biosynthesis (Ros Barcel├│, 2005). Virulence in the hemibiotrophic pathogen is directly correlated to H2O2 production and other ROS and evidenced in Colletotrichum gloeosporioides, Magnaporthe oryzae and Botrytis cinerea where positive correlations occur between sensitivity to H2O2, peroxidase activity, and fungal pathogenicity and virulence are affected as components of ROS-producing enzymes are lacking. Apart from this, regulation of infection pegs and appressoria regulated by massive accumulation of H2O2 and O2ŌłÆ is also evidenced by Marschall and Tudzynski (2016). The local generation of H2O2 is closely associated with effective penetration resistance (Sch├żfer et al., 2004; Shetty et al., 2007) since H2O2 produces necrosis in cells around the pathogen to localize its attack and acts to prevent the fungal penetration to epidermal cells (Kumar et al., 2002; Mellersh et al., 2002) and was evident in present study also. Recently, Sharma et al. (2018) has demonstrated that H2O2 is one of the vital defense signaling molecules that trigger resistance to B. sorokiniana in wheat. The differential clustering of the genotypes based on phenotyping, free radical production and lignin accumulation in response to B. sorokiniana infection suggested the role of these factors in resistance to spot blotch in wheat. This was confirmed by histochemical staining, which provided insights concerning the restriction of the pathogen at penetration sites. This study hence makes it easy to understand the role of H2O2 and lignin in resistance to B. sorokiniana and suggests host plant lignin content as a possible biochemical marker for spot blotch resistance in wheat.
 PDF Links
 PubReader
 Full text via DOI
 Full text via PMC
 Download Citation
 Print
Print