Oak Tree Canker Disease Supports Arthropod Diversity in a Natural Ecosystem
Article information
Abstract
Microorganisms have many roles in nature. They may act as decomposers that obtain nutrients from dead materials, while some are pathogens that cause diseases in animals, insects, and plants. Some are symbionts that enhance plant growth, such as arbuscular mycorrhizae and nitrogen fixation bacteria. However, roles of plant pathogens and diseases in natural ecosystems are still poorly understood. Thus, the current study addressed this deficiency by investigating possible roles of plant diseases in natural ecosystems, particularly, their positive effects on arthropod diversity. In this study, the model system was the oak tree (Quercus spp.) and the canker disease caused by Annulohypoxylon truncatum, and its effects on arthropod diversity. The oak tree site contained 44 oak trees; 31 had canker disease symptoms while 13 were disease-free. A total of 370 individual arthropods were detected at the site during the survey period. The arthropods belonged to 25 species, 17 families, and seven orders. Interestingly, the cankered trees had significantly higher biodiversity and richness compared with the canker-free trees. This study clearly demonstrated that arthropod diversity was supported by the oak tree canker disease.
Microorganisms are the most abundant and diverse organisms on earth. Decomposition, pathogenesis, and symbiosis are critical roles of microbes in natural ecosystems (Andrews and Harris, 2000; Park, 1963; Rudgers et al., 2007). Saprophytes may have the most important role of all microorganisms because they decompose dead organic material to recycle carbon and other nutrients (Natural Resources Conservation, 1999). Some microorganisms have positive interactions with plants, such as mycorrhizae and nitrogen fixation bacteria. During these interactions, the plants mainly provide carbon resources to microorganisms while the plants receive soil macronutrients from the microorganisms (Garg and Chandel, 2010; Raven, 2010). Many microorganisms cause diseases in plants (Agrios, 2006). Some plant pathogens, especially viruses, also have strong interactions with insects and the insect transmission of viruses has been well documented. Sucking insects, such as leafhoppers and aphids, transmit plant pathogens. The reproduction and survival of host plants may be reduced as a result of these interactions (Nault and Ammar, 1989).
Plant diversity is predicted to be positively linked to the diversity of herbivores and predators in a food web. However, the relationship between plant and animal diversity may be explained by a variety of competing hypotheses. According to the “more individual hypothesis,” (Srivastava and Lawton, 1998) greater plant diversity increases herbivore species diversity and the populations of individual species. The opposite hypothesis suggests that less plant diversity increases the abundance of herbivores (Root, 1973). Haddad et al. (2009) provided support for the “more individual hypothesis.” The loss of plant species propagates through food webs and greatly decreases the arthropod species richness, thereby shifting a predator-dominated trophic structure to one dominated by herbivores. Plant diversity is also related to herbivores, as well as being closely related to microbes. Recent studies of tritrophic plant-insect-symbiont interactions have shown that they have pivotal roles in natural ecosystems. For example, sleepy grass (Achnatherum robustum) is associated with a specific endophytic fungus (genus Neotyphodium) that produces alkaloid compounds. The endophyte-produced alkaloids are associated with increased herbivore abundance and species richness (Jani et al., 2010). Faeth and Shochat (2010) suggested another possible role for an endophytic fungus (genus Neotyphodium) in an interaction with a native grass (Festuca arizonica). Infections did not affect the richness of arthropods or others herbivore species but they did reduce the natural enemy richness, especially that of parasites, and there was an increased richness of detritivores. Thus, endophyte-infected plants experienced more damage by herbivores. By contrast, plant-microbe mutualisms could have negative effects on the diversity of insects. For example, the mutualism between tall fescue grass (Lolium arundinaceum) and a symbiotic endophytic fungus (Neotyphodium coenophialum) reduced the plant-feeding arthropod abundance by up to 70% and it also had negative effects on insect diversity. Thus, endophytic fungus mutualisms reduce the insect diversity and enhance the dominance of host plants (Rudgers and Clay, 2008).
The structure of plant communities has major effects on the insect and microbial diversity. Knops et al. (2002) reported that with invasive plants, the grassland plant richness and the incidence of fungal diseases were reduced.
In this study, we investigated the insect dominance, diversity, richness, and evenness in an oak tree site to understand the interaction between a plant disease (canker) and the arthropod diversity. The results clearly indicated that the plant disease increased the biodiversity and to our knowledge, this is the first report of the positive role of plant disease on bio-diversity in natural ecosystem.
Materials and Methods
Description of the oak tree site and characterization of the pathogen
The location of the survey site was located latitude 35.2723 and longitude 127.944. The trees in the site were natural vegetation. The site measured approximately 12×70 m and it was located near commercial agriculture fields and a small creek (Fig. 1A). The tree site contained 44 oak trees and there were 15 Quercus variabilis trees and 29 Q. acutissima trees. Among 44 oak trees; 31 had canker disease symptoms while 13 were disease-free. The average trunk size of the trees was 133.9 cm, which indicated that the average age of the trees was >300 years. The weather conditions during the survey were as follows: on 29-Jul-2011, average temperature = 26.9°C, precipitation = 23 mm, and relative humidity = 80.1%; on 25-Aug-2011, average temperature = 22.8°C, precipitation = 0.5 mm, and relative humidity = 84%; on 8-Sep-2011, average temperature = 22.7°C, precipitation = 0 mm, relative humidity = 68.5%; and on 26-Sep-2011, average temperature = 16.8°C, precipitation = 0 mm, and relative humidity = 69.9%. Most oak tree canker pathogens are fungi in the family Xylariaceae (Ju and Rogers, 1996). The primary symptom of this disease is the appearance of different sized cankers on tree trunks, with or without running dark-brown color sap. In the current study, the pathogen was Annulohypoxylon truncatum, which belongs to the section Hypoxylon. The fruiting bodies of the pathogen were observed under a microscope (Olympus BX-51; Japan) and an electron microscope (JSM-6380LV: Joel Inc., USA). The morphological characteristic of the fungi were compared to previously identified Hypoxylon images (Fig. 1B) (Ju and Rogers, 1996; Cha et al., 2012).

The oak tree site and the symptoms of canker. A: Oak trees at the site. B: The canker disease symptoms and the stromata of the causal pathogen, Annulohypoxylon truncatum (inside circle). The arrow indicates Amphipyra monolitha.
Arthropod surveys and data analyses
The arthropod surveys were performed four times between 29-Jul-2011 and 26-Sep-2011. All of the arthropods were photographed and identified based on their morphological characteristics. The insect communities were analyzed by calculating the diversity index, dominance index, richness index, and evenness index for each survey. The formula used to calculate the dominance index was as follows:
Results
Arthropod fauna diversity in the site
During the survey periods, 370 individual arthropod specimens were identified, which belonged to 25 species, 17 families, and seven orders. Of the arthropods, only two species (two orders) belonged to Chilopoda and the remainder were identified as Insecta (Table 1). However, 265 individuals were Insecta and 105 individuals were Chilipoda, a ratio of 6:4.

Individual species recorded during the survey period
Seven orders, 17 families, and 359 individual arthropods were detected on the cankered trees. By contrast, four orders, five families, and 11 individuals were recorded on the canker-free trees (Table 1). On the first survey day (29-Jul-2011), 47 arthropods were detected on the cankered trees whereas no arthropods were recorded on the canker-free trees (data not shown). On 25-Aug-2011 (second survey), 108 arthropods were detected but only six individuals found on the canker-free trees. On 8-Sep-2011 (third survey), 95 arthropods were recorded and 93 of these were detected on the cankered trees. On 26-Sep-2011 (fourth survey), the cankered trees yielded 115 arthropods, whereas only three individuals were found in the canker-free trees. The centipede Thereuonema hilgendorfi was the dominant species at the site (N = 105). The second most dominant species was a darkling beetle (Encyalesthus violaceipennis) and 87 individuals were detected during the survey period. Interestingly, T. hilgendorfi was the dominant species during July and August while E. violaceipennis was dominant during September (Table 1).
To evaluate the impact of sap on the arthropod diversity, the cankered trees were divided into sap-producing trees and sap-free trees, depending on the presence or absence of sap flow. Of the 30 trees with canker symptom, 13 trees produced sap and 17 trees were sap-free (data not shown). The sap-producing trees yielded 211 individual arthropods, which belonged to seven orders, 15 families, and 21 species. A total of 148 individuals (seven orders, 13 families, and 14 species) were detected on the sap-free trees (Table 1). The dominant species on the sap-producing trees was T. hilgendorfi, while E. violaceipennis was the second most dominant.
This clearly demonstrated that the oak tree canker disease and running sap supported a high arthropod diversity and richness. However, the reason why arthropods preferred the cankered trees to canker-free trees was not clear. It is possible that the cankered trees provided food sources or shelter. Therefore, the arthropod communities were investigated in the inner and outer canker regions. Eleven species (331 individuals) were found in the inner regions of cankers while 18 species (28 individuals) were detected in the outer canker regions (Table 2). The cankered trees with sap yielded 203 individuals (10 species) from the inner canker region and 18 individuals (13 species) from the outer canker region. The inner regions of cankers had lower species diversity but more individuals compared with the outer regions of cankers (Table 2). The results suggested that some species were resident in cankers.

Arthropod species and their detection in and out of canker region
Table 3 shows the classification of arthropods based on their mouth parts. The site yielded 17 species (297 individuals) with chewing type mouth parts and eight species (72 individuals) with siphoning tube type mouth parts. The cankered trees and sap-producing trees yielded 292 individuals and 276 individuals with chewing type mouth parts, respectively. By contrast, 67 individuals collected from cankered trees and 55 individuals from sap-producing trees possessed siphoning tube type mouth parts. Overall, arthropods with chewing mouth parts were more abundant than those with siphoning tube type mouth parts. Centipedes (T. hilgendorfi), darkling beetles (E. violaceipennis), Japanese cockroaches (Periplaneta japonica), and giant stag beetles (Dorcus titanus castanicolor) comprised 104, 86, 41, and 25 of the individuals with chewing type mouth parts, respectively. However, only 55 individual moths from the same species (Amphipyra monolitha) were recorded with siphoning tube type mouth parts and less than three individuals of other species were detected during the survey (Table 3).

Species present in arthropods based on their mouth parts
Cluster analysis
The cankered trees had a significantly higher arthropod richness and diversity compared with the disease-free trees (Table 4). The diversity (H′) and richness (RI) indices with canker were 4.08 and 2.00, respectively, whereas the H′ and RI indices without the disease were 1.67 and 1.37, respectively. However, there were no differences between the dominance (DI) and evenness (EI) values in the cankered and canker-free trees (Table 4). Interestingly, the arthropod dominance, diversity, and evenness did not differ in the sap-producing and sap-free trees (Table 4). The richness of sap-producing trees (index = 3.70) and sap-free trees (index = 2.80) differed little but this may have been due to the number of T. hilgendorfi in the sap-producing trees. In the cankered trees, the arthropods had different cluster values in the inner and outer regions of cankers (Table 4). The inner canker regions had lower richness and diversity values than the outer canker regions. The inner canker regions yielded 11 species whereas the outer canker regions yielded 18 species, but the inner regions produced 303 more individuals than the outer canker regions. The richness (DI) values were 0.57 and 0.29 for the inner and outer canker regions, respectively. Arthropods with chewing mouth parts had higher richness and diversity indices than those with siphoning tube type mouth parts. In the comparison of cankered trees and canker-free trees, arthropods with chewing mouth parts had higher richness and diversity indices, with or without running sap (Table 4).
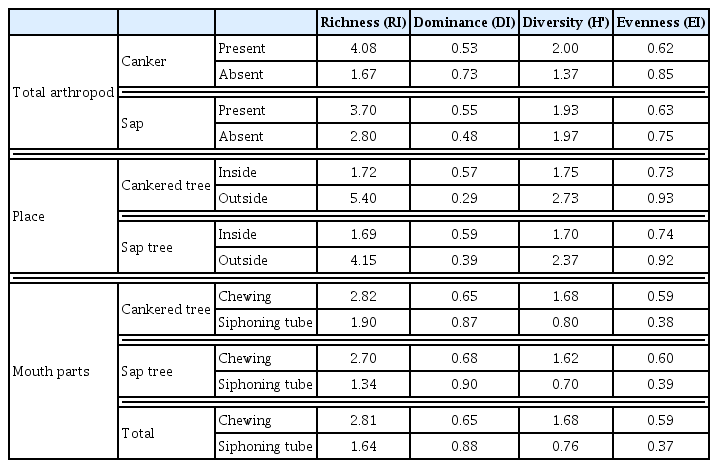
Arthropod richness, dominance, diversity, and evenness index relationships with canker and sap secretion
Discussion
Many plant diseases are caused by plant pathogens that limit the reproduction and survival of infected plants (Agrios, 2006; Nault and Ammar, 1989). In agricultural systems, diseases have negative effects on crop yields. However, diseases have led to the evolution of host plants that are susceptible to, resistant, or tolerant of various pathogens (Agrios, 2006; Simms and Triplett, 1994; Mauricio et al., 1997). The genetic diversity and the community structures of plants have been affected by pathogens. The relationship between plants and fungal mycorrhizae can reduce or increase insect diversity (Rudgers and Clay, 2008; Jani et al., 2010). Many previous studies have indicated that plant-insect or plant-microbe interactions can have major effects on the biodiversity in ecosystems. However, previous studies have not investigated the effects of plant disease on biodiversity. The oak tree canker investigated in the present study generally created deep holes in the bark of tree trunks. The diseased trees had higher arthropod diversity and richness. A total of 359 individual arthropods were found on cankered trees, whereas only 11 individuals were detected on canker-free trees (Table 1). The trees with symptoms of canker had a significantly higher biodiversity and richness than the canker-free trees (Table 4). These results suggest that the plant disease had a positive effect on biodiversity in this natural ecosystem.
Oak tree sap exudates have various colors, including black, brown, red, and white (Wilson and Hort, 1926). The sap exudates mainly contain volatile compounds, such as alcohols, ketols, and acids. The ethanol content of sap is 660–1100 ppm and the acetic acid concentration is 480–553 ppm (Ômura et al., 2000). Some aliphatic acids and ketols are known to have insect attractant properties (Ômura et al., 2000). Many previous studies have claimed that tree sap provides a food resource for various insects (Hunter and Schultz, 1995; Yoshimoto and Nishida, 2007; Yoshimoto et al., 2005). Thus, the sap exuded from cankered trees may attract more insects that use it as a nutritional food resource. There is a higher insect population density on trees with sap and a greater diversity is supported in the insect communities on sap trees (Yoshimoto et al., 2005). However, the current study did not detect any notable differences in the diversity, dominance, and evenness between sap-producing and sap-free trees when we compared them within the cankered trees. Arthropods with chewing mouth parts had significantly higher richness and diversity indices than those with siphoning tube type mouth parts on cankered oak trees with or without sap. Thus, the effect of sap on the total arthropod diversity and richness was not significant in the presence or absence of cankers. A comparison of the cankered and canker-free trees detected significant differences in the diversity and richness, irrespective of the presence of sap exudates. Lill and Marquis (2003) placed artificial shelters on oak trees (Quercus alba) and the richness and guild structure of leaf-chewing herbivores increased significantly compared with shelter-free trees. The shelters were removed from the site after a period and the herbivore richness declined to that of the shelter-free trees. The current study produced similar results because the cankered trees had a significantly higher insect diversity and richness than the canker-free trees, irrespective of the presence of sap. The cankered trees supported a higher arthropod diversity and richness but the difference in the biodiversity in the inner and outer regions of cankers suggested that some species were common in the inner canker regions. There was a similar pattern in the sap-producing trees and the sap-free trees. Therefore, these results indicate that the arthropods used the cankers as shelters rather than food sources. The arthropods with chewing mouth parts had a higher richness and diversity than those with siphoning tube mouth parts in the cankered trees. The chewing mouth parts allowed arthropods to form a space inside the cankers.
Taken together, these results suggest that cankered trees provide shelter for insects and that nutrient availability is less important for insect diversity in this plant-disease-insect three-way interaction. This study suggests that some plant diseases have a positive role in natural ecosystems, particularly by supporting insect diversity. To the best of our knowledge, this is the first demonstration of a positive effect of a plant disease on insect diversity in a natural ecosystem.
Acknowledgements
This research was performed with the support of the “Cooperative Research Program for Agriculture Science & Technology Development (PJ009839)” from the Rural Development Administration of Korea.