

Bacterial grain rot of rice, which is caused by Burkholderia glumae (Kurita and Tabei 1967; Urakami et al., 1994), is one of the major disease problems in global rice production (Ham et al., 2010). B. glumae has been reported as a rice pathogen present in many rice-growing countries worldwide (Andrea and Fernando, 2014; Jeong et al., 2003; Kim et al., 2010; Luo et al., 2007; Nandakumar et al., 2009; Riera-Ruiz et al., 2014; Shahjahan et al., 2000; Trung et al., 1993) since it was first described in Japan (Goto and Ohata, 1956). Symptoms of BGR include grain rot (also referred to as panicle blight), seedling rot and sheath rot. Diseased panicles usually have spikelets blighted with rotten grains. Upright panicles with brown color are typically found in severely infected fields (Ham et al., 2010). This symptom causes serious yield losses (Cha et al., 2001; Tsushima et al., 1995b). Yield loss caused by BGR were up to 40% in 1995 and 1998 in Louisiana (Nandakumar et al., 2009; Shahjahan et al., 2000) and 75% loss in grain yield has been reported in Vietnam (Trung et al., 1993).
Bacterial seedling rot can also be caused by rapid increase of B. glumae population in the epidermis of plumules (Hikichi, 1993a; Hikichi et al., 1995). B. glumae were found in and on the upper and lower epidermis (Hikichi et al., 1993) and could survive on the leaf sheath of upper leaves and the flag leaf without showing rot symptoms (Hikichi, 1993c). It then invades flowering spikelets, multiplies rapidly and finally causes grain rot (Hikichi et al., 1998; Hikichi et al., 1994).
Outbreak of the BGR epidemics varied depending on weather conditions during the heading period of rice (Lee et al., 2010). It generally occurred under conditions of prolonged high temperatures and frequent rainfall during the heading and flowering periods of rice (Cha et al., 2001; Tsushima et al., 1995b). The spikelets were most susceptible on the day of flowering and the bacteria favored humid conditions of over 95% relative humidity for 24 hours at flowering (Tsushima et al., 1995a). Yokoyama and Okuhara (1987) noted that BGR developed when minimum daily temperature was Ōēź23┬░C and moderate rainfall (<30 mm/day) occurred during the heading stage of rice.
Use of pathogen-free seeds, seed treatment and foliar sprays of bactericides such as oxolinic acid and kasuga-mycin are the main tactics to control BGR (Azegami et al., 1987; Hikichi, 1993a; Hikichi, 1993b; Hikichi, et al., 1994; Hikichi et al., 1995; Isogawa et al., 1989). Especially the foliar sprays were recommended two times, i.e. before and after the heading stage of rice plants. Also, recently rice health management programs often recommend the one-shot application of granular formulations of disease resistance-inducing chemicals, such as tiadinil, orysastrobin and isotianil, to rice seedlings in the nursery boxes to control multiple diseases such as leaf sheath blight, rice blast, bacterial leaf blight and BGR (Takashi and Hideo, 2013). In the rice health management programs, no further chemical applications before and after the heading stage of rice were advised to control diseases on rice panicles. The changes in chemical control strategy in the rice health management programs and the yearly variations of BGR incidence caused difficulty to rice growers protecting panicles from BGR. Consequently disease forecasts for possible risks of BGR would help rice growers decide whether to spray bacteriocide before and after the heading stage for better management of rice health. Besides, it may help save disease control cost by reducing the use of expensive chemicals like oxolinic acid.
As an effort to develop disease forecast models for BGR, Tsushima et al. (1996) reported that the detection frequency of the pathogen on flag leaf sheaths was significantly correlated with disease incidence on panicles a week after the heading time. They found that the bacterial population on flag leaf sheaths was important in primary infection of the disease. However, application of the bacterial population model by Tsushima et al. (1996) is not practical due to low efficiency of dilution plate method in detecting naturally occurring populations of the bacteria in the field.
The weather-driven models developed by Lee et al. (2004) were linear regression models with various weather factors as predictor variables. They selected a multiple regression model with six predictor variables including minimum and average temperatures and relative humidity, number of rainy days and average wind speed during 7 days from 3 days before to 3 days after the heading date. The coefficient of determination (R2) of the model was 0.824, indicating that 82.4% of the variation in disease incidence was accounted for by the six predictor variables. However, the multiple regression model has overestimated BGR development in 1999 and 2001 when no disease occurred (unpublished data).
In this study, we have established the following hypotheses regarding conditions for epidemic development of BGR in rice paddy fields: (1) B. glumae needs to attain a certain population size in upper leaf sheaths of rice plants prior to the heading stage, and (2) weather conditions need to be favorable for the bacterial infection during the heading stage of rice plants. Based on the hypothesis, a disease forecast model for BGR (referred to as BGRcast hereafter) was developed to determine conduciveness of weather conditions for population growth of B. glumae in association with rice plants and panicle infection by the bacteria during the heading stage of rice plants. The BGRcast was also evaluated regarding its capacity to support decision-making for bactericide sprays at the pre- and post-heading stage in the field. In this study, we have analyzed disease and weather data that were obtained from multi-year field experiments in 1998-2004 and 2010. Of the data sets, the same data from 1998 were used in the previous study to develop linear regression models (Lee et al., 2004).
Materials and Methods
Field plot
Disease incidence of BGR was obtained from an experimental rice paddy field where local performance tests were conducted to select rice cultivars suitable for the Jeonnam Province in 1998-2004 and 2010. In order to evaluate agronomic performance each year, 11-29 rice cultivars were grown at the experimental paddy field located at the Jeonnam Agricultural Research and Extension Services (JARES) in Naju, Korea. Rice seeds disinfected by prochloraz EC (Hankooksamgong Co., Ltd., Korea) were sown and raised on the protected semi-irrigated rice nursery for 30 days. Three to five rice seedlings of 30-days old were transplanted per hill on 30 May and 15 June each year. The experimental paddy field was divided into the early and the late transplanting plots. On each plot, rice cultivars were planted in a randomized block design with 3 replications. Each experimental unit consisted of 6 rows 30 cm apart and 90 hills per row at the between-hill space of 14 cm. Consequently the total of 540 hills composed an experimental unit for each rice cultivar. Fungicides and insecticides were sprayed following the calendar-based conventional spray program. However, no bactericides were applied for this study.
Disease and rice growth assessment
Disease incidence of BGR was measured in terms of the percentage of infected panicles per hill at three weeks after the heading date of rice plants, which was determined when approximately 40% of panicles emerged. Disease assessment was made by counting the number of diseased and healthy panicles in a hill. For the sake of efficiency of disease assessment, only 100 hills per plot were sampled at random when more than 30% panicles were diseased. For those plots with less than 30% panicles diseased, all 540 hills per plot were examined. Disease incidence of a plot was determined by dividing the number of diseased panicles by the total number of panicles of the hills that were examined in the plot. Disease incidence data obtained from three replications for each cutivar and transplanting date were pooled together prior to data analyses. Since disease incidence data showed systematic increase in variation over time, disease incidence data were log-transformed by taking ln (% disease incidence + 1) before statistical analysis.
Plant growth of each rice cultivar was monitored every day to determine the developmental dates of rice such as the date of first panicle emergence and the heading date at which approximately 40% panicles emerged.
Weather data
Daily weather data on minimum and maximum temperature, average relative humidity and rainfall were obtained from the synoptic weather data provided by the Gwangju Regional Meteorological Administration, Korea. The disease incidence, rice plant development and weather data from 1998-2000 were used to develop a disease forecast model for BGR. Validation of the disease forecast model was performed based on the data from 2001-2004 and 2010.
Three phases of epidemic development of BGR
Considering epidemiology of B. glumae, epidemic development of BGR was divided into three phases with regard to the developmental stages of rice plants (Fig. 1). The lag phase starts from the transplanting date and continues until weather conditions become favorable for rapid growth of the bacterial population. The inoculum build-up phase is the period that the bacterial population is able to increase significantly to colonize the leaf sheaths of upper leaves and the flag leaf. It is assumed that this period starts during the prebooting stage of rice plants and ends at the first panicle emergence when spikelets on panicles become available for infection by B. glumae. The infection phase is assumed to be 7 days of the heading stage from 3 days prior to the heading date to 3 days after the heading date. It is known that the majority of panicles emerge during this period (Lee, 2010). Panicle infection occurs during the infection phase and subsequently developed grain rot symptoms.
Since bacterial growth rate is affected by environmental conditions, the transition time from lag phase to inoculum build-up phase would vary from year to year. In this study, an empirical approach was made to delineate the two phases by examining statistical correlations between conduciveness of weather conditions for BGR development during the infection phase and disease development in 1998-2004 and 2010. The correlation coefficients obtained by changing duration of the inoculum build-up phase were compared to determine the most appropriate date for delineating the lag and inoculum build-up phases. For this analysis, the duration of inoculum build-up phase was counted backward from the date of first panicle emergence that was observed for individual rice cultivars in the experimental field each year.
Daily conduciveness model
Conduciveness of weather conditions to epidemic development of BGR was evaluated using daily minimum temperature and average relative humidity. The daily weather data in 1998-2000 were used for the model development. The daily conduciveness, which is subjected to relative humidity conditions, was determined by the BGRcast model as follows:
where Tni and RHi are daily minimum temperature and average relative humidity on day i, respectively; and Ci is the daily conduciveness of weather conditions on day i. The base temperature (Tnbase) and relative humidity (RHbase) in the BGRcast model were determined empirically using the disease incidence and weather data from 1998-2000. The Ci is determined every day starting from the transplanting date until the end of heading stage of rice plants.
The average of Ci was calculated for the inoculum build-up and infection phases of BGR development by:
where C is the daily average of Ci for the period of each phase of BGR development, and n is the number of days for the period. For the inoculum build-up and infection phases, C will be denoted as Cinc, and Cinf, respectively. In order to determine n for Cinc, 10, 15, 20, 25 and 30 days prior to the date of first panicle emergence were evaluated empirically based on the correlation coefficients between disease incidence and Cinf using the data from 1998-2004 and 2010. The n for Cinf is 7 days from 3 days prior to the heading date to 3 days after the heading date as described above in the definition of infection phase. Since Cinc indicates conduciveness of weather conditions for inoculum build-up of B. glumae, it is assumed that no inoculum is available for panicle infection if Cinc = 0. Consequently, Cinf is calculated only if Cinc > 0. Otherwise, Cinf is assigned zero even if weather conditions during the infection phase are conducive to panicle infection by the bacteria.
Thresholds of Cinc and Cinf
Thresholds of Cinc and Cinf that can be used as criteria for deciding whether to spray bactericides were determined based on their relationship with disease incidence in 1998-2000. Since two sprays of bactericides at the pre- and post-heading period of rice plants are commonly made by rice growers in Korea, Cinc and Cinf can be used to determine whether to spray bactericides at the pre- and post-heading stage, respectively.
Model validation and application
The BGRcast model was tested for its capacity to forecast risk of infection by B. glumae using disease and weather data from 2001-2004 and 2010. Temporal changes of Ci, Cinc and Cinf were examined for each year and validation of the BGRcast model was performed in three ways: (1) The relationship between Cinf and log-transformed disease incidence using 226 data sets from the field experiments was analyzed to evaluate the capacity of Cinf in describing variations of BGR incidence under different weather conditions; (2) the observed disease incidence in 2001-2004 and 2010 was compared with those estimated by the regression equation describing the relationship between disease incidence and Cinf in 1998-2000; and (3) the two-way contingency table analysis (Sokal and Rohlf, 1973) was conducted to evaluate accuracy of BGR forecast by the BGRcast model. A contingency table was created for two variables, method (observation and forecast) and output (disease and no disease). In the two-way contingency table analysis, three categorical measures of accuracy for disease forecast were calculated. The probability of detection (POD) is the percent of disease development that are correctly forecasted, and the false alarm ratio (FAR) is a measure of the failure of the BGRcast model to exclude no disease cases. The bias score (or ŌĆśfrequency biasŌĆÖ) is a measure of the extent to which one response is more probable than another (Jolliffe and Stephenson, 2012). In this study, the bias score was the ratio of positive forecast frequency to observed frequency of disease occurrence, so that it measured how frequently the BGRcast model forecasted BGR as compared to the observed occurrence of BGR.
The BGRcast model was applied to the data from different rice cultivars in 2001 and 2010 to evaluate its effectiveness in determining whether to spray bactericides at the pre- and post-heading stage of rice plants. In order to examine responses of Cinc and Cinf to different heading dates of rice plants, rice cultivars with different heading dates at late July and early, mid and late August were selected and recommendations for the bactericide sprays at the pre- and post-heading period were determined based on Cinc and Cinf, respectively. Effectiveness of the forecast model was discussed by taking disease incidence into consideration with reference to the disease forecast.
Results
Heading dates and disease incidence
Table 1 shows rice heading dates and disease incidence of BGR on 11 rice cultivars when seedlings were transplanted on 30 May and 15 June in 1998-2000. It was commonly noticed in the field that panicle emergence started approximately 3 days before the heading date. The rice cultivars were grouped by the maturity types. The heading date of a cultivar varied depending upon year and transplanting date, indicating that weather conditions after transplanting affected the heading dates of rice cultivars. The late transplanting by 16 days resulted in late headings by 6-9 days in 1998, 11-14 days in 1999, and 3-5 days in 2000. Rice cultivars within a same maturity type showed similar heading dates as compared with the differences in heading dates between different maturity types.
Disease incidence varied among three replications for each cultivar and transplanting date due to obvious spatial variations in disease incidence over the experimental field. In order to negate the effect of spatial variations in the data analyses, BGR incidence data obtained from three replications were pooled together prior to the analyses. Disease incidence also varied depending upon years, transplanting dates, and rice cultivars. Severe epidemic of BGR occurred in 1998 with disease incidence ranging 0-69.2%, whereas there was no disease observed in 1999. Disease incidence in 2000 ranged 0.3-6.1% on five rice cultivars. In 1998, rice cultivars Samcheon and Odae, which belonged to the early maturity type, were diseased more severely when transplanted at 15 June than at 30 May. On the contrary, the other rice cultivars that belonged to the middle and middle-to-late maturity types showed higher disease incidence when transplanted at 30 May than at 15 June. When compared between transplanting dates for each rice cultivar, disease incidence in 1998 was higher when panicle heading occurred on mid August (8-14 August) than on early (2-3 August) or late (16-25 August).
Summary of data from the performance trials conducted in 2001-2004 and 2010 are presented in Table 2. Different heading dates were induced by transplanting at different dates. The number of diseased cultivars and disease incidence varied depending on years and transplanting dates. Weather conditions were favorable for B. glumae only in 2010 especially when transplanted early.
Base temperature and relative humidity
Using the disease incidence and daily minimum temperature and mean relative humidity in 1998-2000, the scatter diagrams were plotted in Fig. 2. It was noticed in the scatter diagrams that no disease was observed when daily minimum temperature was lower than 22┬░C or when daily mean relative humidity was lower than 80%. Based on this observation, the base temperature (Tnbase) and relative humidity (RHbase) were determined to be 22┬░C and 80%, respectively, in the BGRcast model. Consequently, the BGRcast model becomes:
Delineation between the lag and inoculum build-up phases
Using all data from 1998-2004 and 2010, Cinc and Cinf were calculated for 10, 15, 20, 25 and 30 days prior to the date of first panicle emergence. In this calculation, if Cinc = 0, then Cinf was assigned 0 even if the weather conditions during the heading stage were favorable for panicle infection by B. glumae. The correlation coefficients between Cinf and BGR incidence were plotted against the number of days prior to the date of first panicle emergence (Fig. 3). All correlation coefficients were statistically significant (pŌēż0.05) and it was highest for 20 days. Based on this result, Cinc, which is the average daily conduciveness during the inoculum build-up phase, was calculated for 20 days prior to the date of first panicle emergence.
Environmental conduciveness to BGR epidemic
Environmental conduciveness of weather conditions to epidemic development of BGR was calculated for 1998-2000 using the BGRcast model (Fig. 4). The daily conduciveness, Ci, showed clear difference among the three years in weather conditions for BGR development. The Cinc, which is the moving average of Ci for the past 20 days, indicated yearly differences in conduciveness of weather conditons for inoculum build-up prior to the first panicle emergence. In 1998, weather conditions were favorable for inoculum build-up of the bacteria from 27 June until the end of August. In 1999, however, Cinc remained zero until 22 July, indicating that weather conditions were not conducive to inoculum build-up until mid to late July. In 2000, Cinc were slightly higher than zero from 1 July to the end of August, suggesting that the bacterial population in association with rice plants was probably able to increase at a minimal level prior to panicle emergence of rice plants.
Conduciveness of weather conditions to panicle infection by B. glumae during the heading stage of rice plants was plotted in Fig. 4. The Cinf is the average of Ci for 7 days from 3 days prior to the heading date to 3 days after the heading date. It was observed that the more than 80% of panicles were emerged during the 7 days. In 1998, Cinf indicated that weather conditions were highly conducive to panicle infection by the bacteria throughout the heading stage of rice plants. The Cinf became zero on 22 August and afterward. In 1999, Cinf was zero prior to 21 July and during 4-14 August, and weather conditions were conducive to panicle infection for short periods during 23 July-3 August and 15-23 August. The Cinf was down to zero after 24 August. In 2000, weather conditions during late July and August were slightly conducive to panicle infection except for the short periods of 27-31 July and 8-12 August. The Cinf remained zero from 28 August.
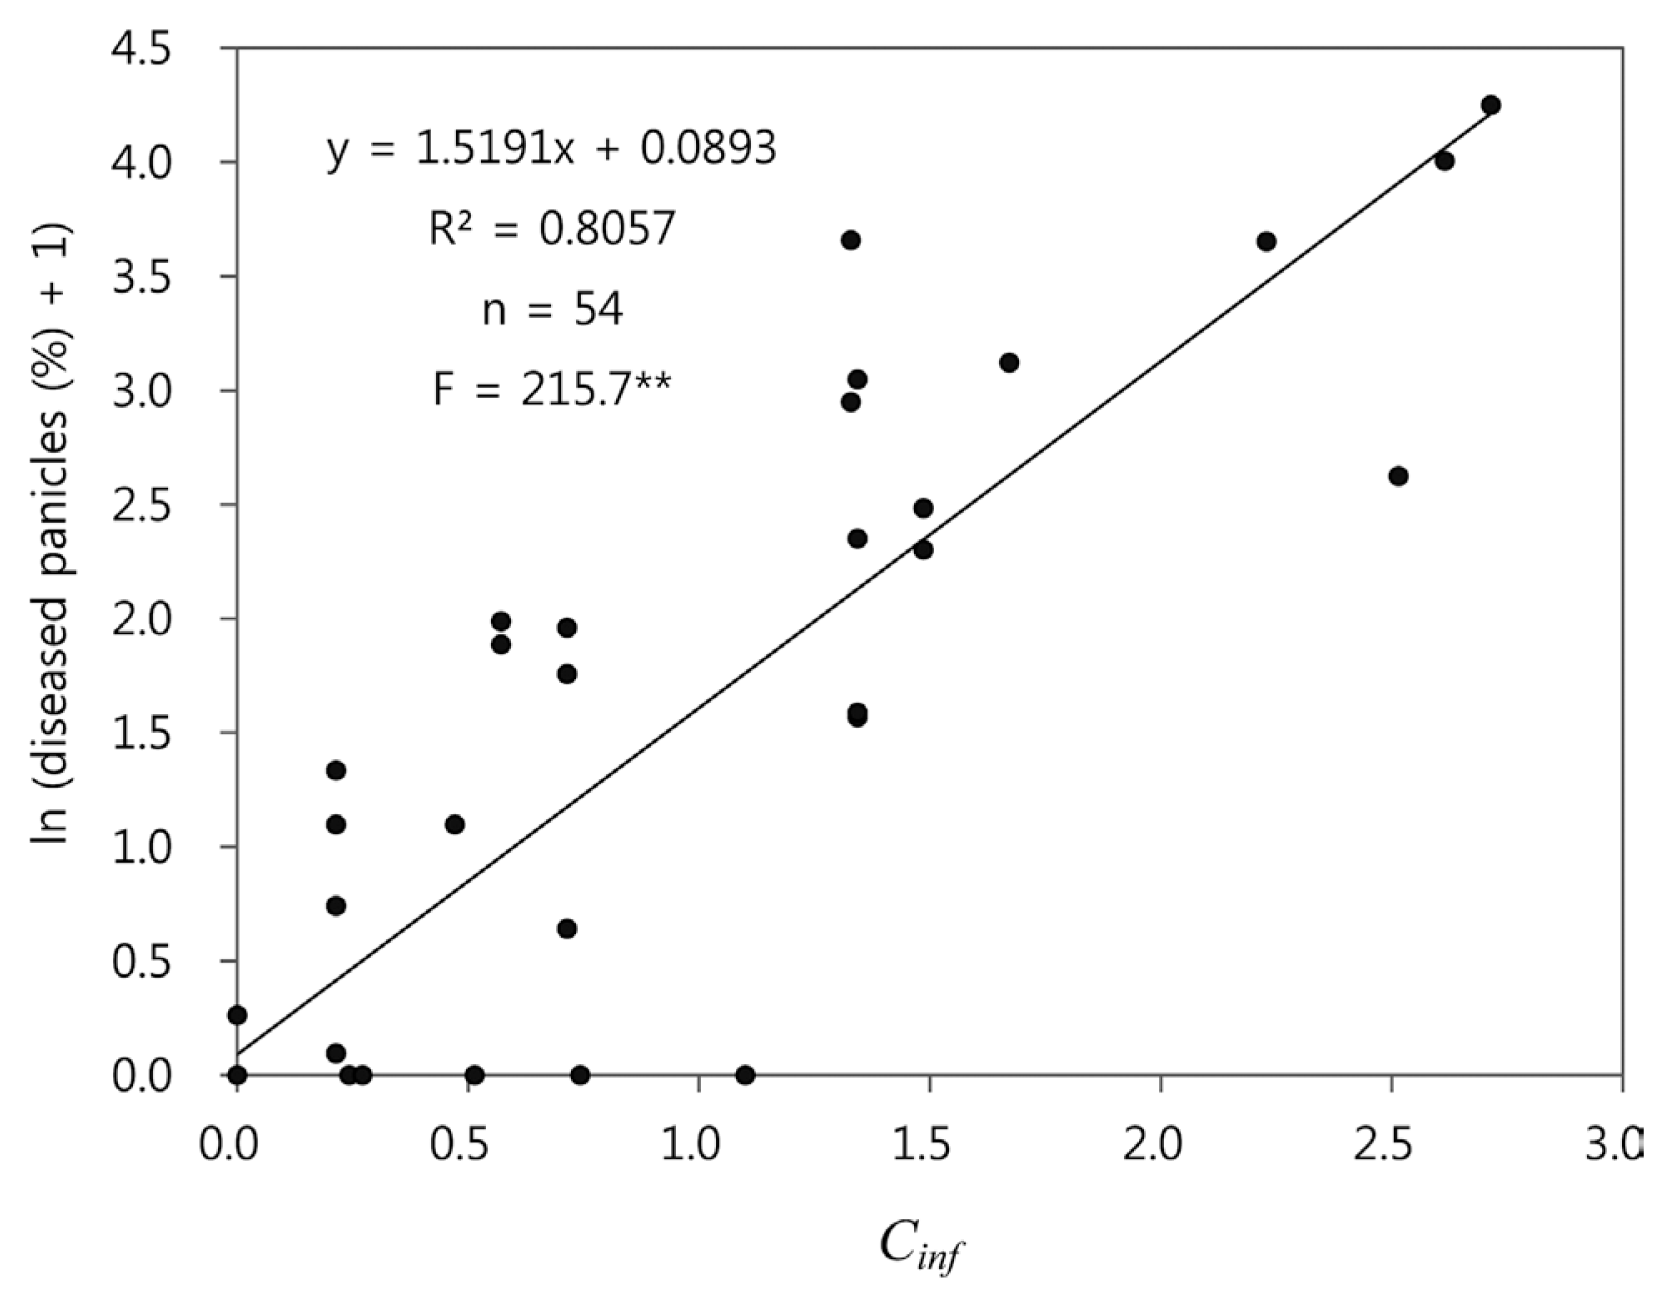
In order to evaluate epidemiological significance of the environmental conduciveness that was measured by Cinf, a regression analysis was conducted between Cinf and log-transformed disease incidence of BGR on 11 rice cultivars in 1998-2000 (Fig. 5). The regression equation was highly significant (pŌēż0.01) and the coefficient of determination (R2) was 0.806, suggesting that 80.6% of variation in the log-transformed disease incidence was accounted for by Cinf. According to the regression equation, when Cinf = 0.4 and 1.0, estimated disease incidence is approximately 1.0% and 4.0%, respectively.
Thresholds of Cinc and Cinf
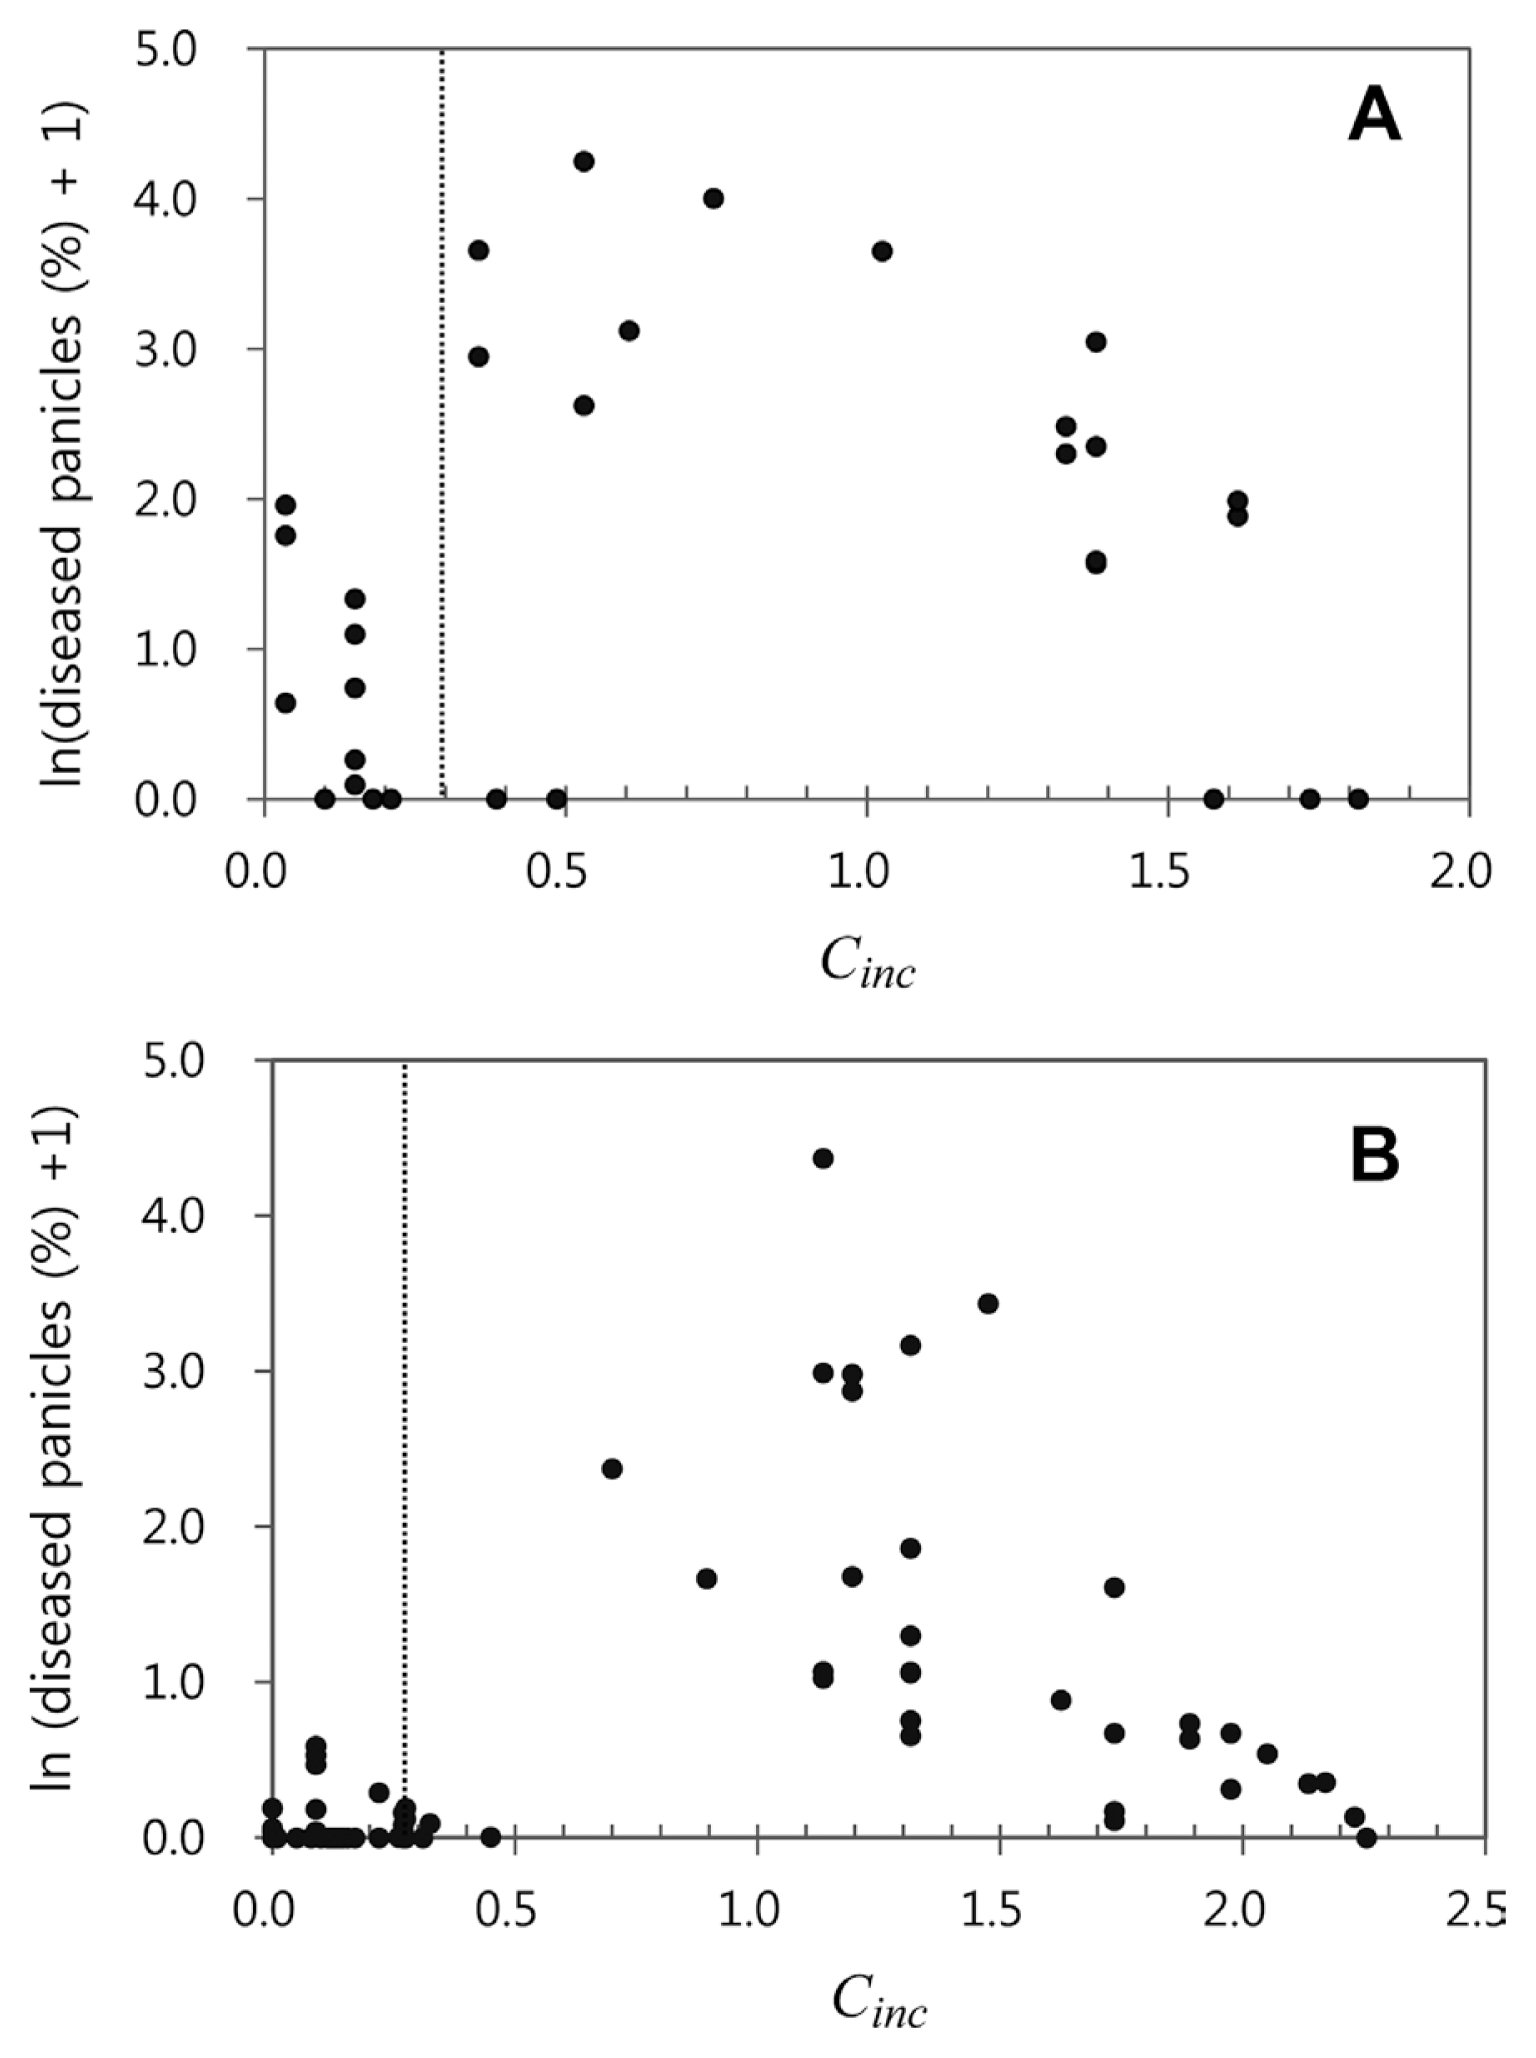
Decisions were made to determine the thresholds of Cinc and Cinf considering their relationship with disease incidence in 1998-2000. In this study, we decided the thresholds of Cinc and Cinf to be 0.3 and 0.5, respectively. According to the regression equation in Fig. 5, disease incidence for Cinf = 0.5 would be 1.34%, which means that less than one panicle is diseased in a hill with 30 panicles. As for Cinc, the scatter diagram for Cinc and log-transformed disease incidence in Fig. 6A was examined to determine the threshold of Cinc. Data points in the diagram was divided into two groups; one with Cinc < 0.3 and the other with Cinc Ōēź 0.3. The former included 19 cases and the latter 35 cases. It was noticed that 20 out of 35 cases in the latter group had disease incidence of 0% and 18 of the 20 cases had Cinf = 0.0. The scatter diagram of 226 data points from 2001-2004 and 2010 also showed two groups clearly with regard to Cinc (Fig. 6B).
Model validation and application
Using the BGRcast model, the environmental conduciveness to BGR development, which was represented by Ci, Cinc and Cinf, was calculated for 2001-2004 and 2010 (Fig. 7). The daily conduciveness, Ci, showed differences in weather conditions for BGR between years, being most favorable in 2010. In general, weather conditions in 2001-2004 were not favorable for BGR development. The Cinc indicated that environmental conduciveness of weather conditions during mid- and late July in 2001-2004 appeared minimal to support inoculum build-up of B. glumae, whereas it was high in 2010. The environmental conduciveness during the heading stage of rice plants, which was expressed in Cinf, was very low in 2001-2004. The Cinf remained high throughout the heading stage of rice plants, except for 21 August, in 2010.
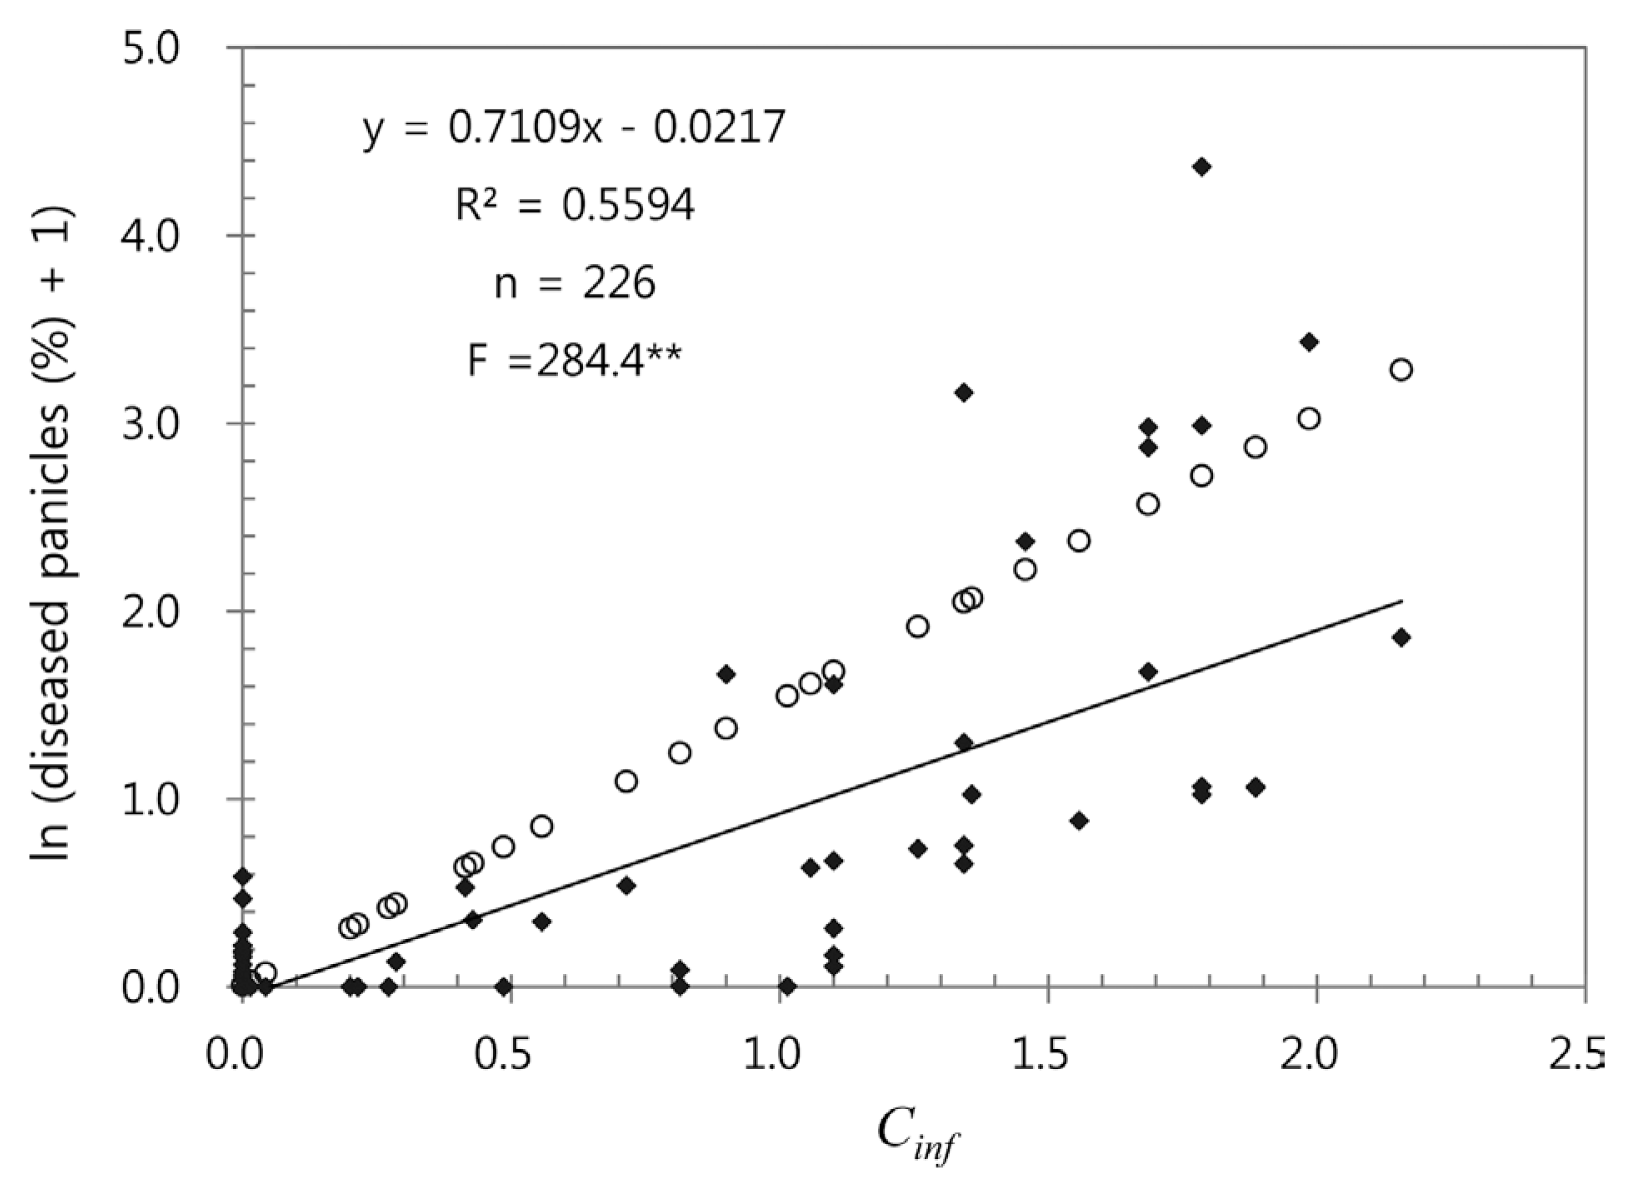
Using 226 data sets from 2001-2004 and 2010, a regression analysis was conducted to determine quantitative relationship between Cinf and log-transformed disease incidence of BGR (Fig. 8). The regression equation was highly significant (pŌēż0.01) and the coefficient of determination (R2) was 0.559, suggesting that 55.9% of variation in the log-transformed disease incidence was accounted for by Cinf. Of 226 data points used in the regression analysis, disease incidence of 163 data points was zero. The disease incidence in 2001-2004 and 2010 was lower than the expected by the regression equation in Fig. 5, which was determined based on the data from 1998-2000.
The BGRcast model was evaluated for its capacity in determining possible occurrence of BGR using the two-way contingency table analysis (Table 3). Disease events regardless of severity of disease incidence have occurred in 27.9% cases of 226 data points. The disease forecast hit in the cases of 19.9% and missed 8.0% cases. Consequently, POD by the disease forecast was 71.4% of actual disease occurrences. The disease forecast resulted in false alarm for disease events in 13.3% cases, and FAR was 47.6%. The FAR is the percent of forecasting disease development that did not occur in reality. The bias score was 1.19, suggesting that the BGR forecast model could forecast risk of BGR development slightly more frequently than actual development of the disease.
Recommendations for bactericide sprays at the pre- and post-heading stage were presented in Table 4 as compared with disease incidence that occurred without any bactericide sprays. As shown in Fig. 7, conduciveness of weather conditions to BGR development was minimal in 2001, whereas it was high in 2010. Four cultivars were selected each year from 29 and 23 rice cultivars in 2001 and 2010, respectively. Rice cultivars, maturity types, transplanting dates, heading dates and disease incidence were taken into consideration to select rice cultivars each year. Differences in Cinc and Cinf were noted between cultivars and between transplanting dates. Based on the thresholds of Cinc (0.3) and Cinf (0.5), recommendations were made for bactericide sprays at the pre- and post-heading stage of rice plants, respectively. The results showed that cultivar Odae needed no sprays at all regardless of transplanting dates in 2001. For cultivars Sura, Shindongjin and Ilpum transplanted on 15 June, Cinc was Ōēź 0.3 and one spray at the pre-heading stage was recommended. With regard to the cases in 2010, cultivar Manna was recommended one spray at the post-heading stage when transplanted on 30 May. However, both sprays at the pre- and post-heading stage might have been necessary, when cultivar Manna was transplanted late on 15 June. For cultivar Ilmi, both sprays were advised if transplanted 30 May, whereas it was probably needed to make one spray at the pre-heading stage when transplanted late on 15 June. Cultivars Haechanmul and Jinback were recommended two sprays at both the pre- and post-heading stage regardless of transplanting dates in 2010.
Discussion
A daily conduciveness model was developed to forecast risk of BGR by estimating environmental conduciveness to the disease development using daily weather data. Epidemiological knowledge regarding effects of weather conditions on development of the disease was adopted from the literature (Cha et al., 2001; Hikichi, 1993c; Tsushima, 1996; Tsushima et al., 1985; Tsushima et al., 1995a; Tsushima et al., 1996; Yokoyama and Okuhara, 1987). Information on population dynamics of B. glumae in association with rice plants and effects of weather factors on BGR development were taken into special consideration in the process of model development.
The concept of disease triangle in plant pathology is the central theorem of the BGR forecast model, stating that if bacterial inoculum is available at the right time of rice plant development, then successful infections occur under favorable environmental conditions. The environmental conduciveness proposed in this study is a measure of conduciveness of weather conditions for population growth of B. glumae and panicle infection by the bacteria in the field. The disease triangle concept was fully exploited in the BGR forecast model by introducing the environmental conduciveness and defining the three phases of epidemic development of BGR in relation to the development stages of rice plants.
Disease incidence of BGR and heading dates of rice plants are affected by weather conditions (Lee et al., 2004; Oldeman et al., 1987; Yokoyama and Okuhara, 1987). The difference in heading date and BGR incidence of a rice cultivar between transplanting dates in Table 1 suggested that the variations in disease incidence was due to difference in weather conditions at the different time-windows of heading stage. Difference in disease incidence between rice cultivars was also observed in 1998. However, no disease occurred in 1999 on all rice cultivars tested and cultivar resistance to BGR could not be confirmed in this study. No single gene resistance to BGR has been found yet and a QTL on chromosome 1 that controls BGR resistance has been reported (Mizobuchi et al., 2013; Pinson et al., 2010). Therefore, the variation in disease incidence observed in this study was considered to be mainly due to weather conditions rather than difference in disease resistance between rice cultivars. Severe occurrence of BGR on rice plants with heading dates in mid-August regardless of rice cultivars in 1998 supported the fact that weather conditions during the heading stage of rice plants were crucial for BGR development.
In the BGRcast model, Tnbase = 22┬░C and RHbase = 80% were selected empirically based on the data from 1998-2000. Coincidentally, Mogi and Tsushima (1984) reported that BGR occurred severely when daily minimum temperature was 22-23┬░C during the second half of rice growth period. Yokoyama and Okuhara (1987) also reported that BGR occurred severely when the average daily minimum temperature was 23┬░C during the five days in the middle of heading stage of rice plants with rainfall of 5-30 mm/day. With regard to relative humidity, humid conditions or rainfall were emphasized in order to have severe disease incidence, but no specific relative humidity was reported to be a minimum for BGR (Lee et al., 2004; Yokoyama and Okuhara, 1987). By having RHbase = 80% in the BGRcast model, dry conditions that would not be favorable for bacterial growth and infection were eliminated from the calculation of environmental conduciveness.
The duration of inoculum build-up phase was determined to be 20 days backward from the date of first panicle emergence. The 20 days prior to the first panicle emergence are approximately the period of booting stage of rice plants (Lee, 2010; Moldenhauer and Slaton, 2001). It has been reported that bacterial population of B. glumae on the upper leaf sheaths at the booting stage affected disease incidence of BGR (Hikichi, 1993c; Tsushima et al., 1991; Tsushima and Naito, 1991; Tsushima, et al., 1996). Cinc was considered a measure of weather conditions affecting the availability of active inoculum for panicle infection.
The Cinf indicated conduciveness of weather conditions for panicle infection during 7 days of the heading stage of rice plants. It usually takes 7 days from the first panicle emergence to have the last effective panicle emerged (Lee, 2010). It was also observed in the field that more than 80% of panicles have emerged during the 7 days in all rice cultivars. In this study, the date of first panicle emergence was determined to be 3 days prior to the heading date that was observed in the field. By defining Cinc and Cinf in relation to the date of first panicle emergence and the heading stage of rice plants, they can be used in general terms representing environmental conduciveness regardless of rice cultivars, transplanting dates, locations, year etc. Consequently, the BGRcast model can be applicable widely for diverse rice management systems with different rice cultivars.
Temporal changes of Ci, Cinc and Cinf in Fig. 4 indicated how favorable the weather conditions were for BGR development in 1998-2000. The difference in disease incidence among the three years was well reflected by Cinc and Cinf. Considering Cinc and Cinf together, infection risk by B. glumae in 1998 was high, and very low in 1999 and 2000. In 1998, weather conditions were highly conducive for BGR development from late July to 21 August. From 22 August, 1998, Cinf remained zero, suggesting that risk of panicle infection by the bacteria would be very low if the heading date was later than 21 August. It was interesting to note that no disease development was observed when the heading date was later than 21 August in 1998 regardless of rice cultivars.
The regression equation in Fig. 5 was an empirical model describing the relationship between Cinf and log-transformed disease incidence in 1998-2000. Statistical significance of the regression equation implied that Cinc and Cinf could be used to represent conduciveness of weather conditions to BGR development. However, the regression equation overestimated log-transformed disease incidence in the validation test using the data from 2001-2004 and 2010 in Fig. 8. In the validation tests, the BGRcast model identified differences between years in conduciveness of weather conditions for BGR development. The apparent differences in disease incidence among 2001-2004 and 2010 were reflected in the differences in Ci, Cinc and Cinf. The capacity of the model to forecast possible risk of BGR was proven by the statistical significance of regression equation in Fig. 8. However, the regression equation was different from the one determined based on the data from 1998-2000 in Fig. 5. Therefore, it was concluded that the BGRcast model in this study could be used to forecast possible risk of BGR based on daily weather data, but it might not be capable of estimating amount of disease incidence. In the two-way contingency table analysis in Table 3, it was found that 71.4% of the cases of BGR occurrence were forecasted correctly by the model and 47.6% of its warnings were untrue. As suggested by the bias score of 1.19, slightly more frequent warnings could be made by the model as compared with actual occurrence of BGR. Consequently, the BGRcast model would help rice growers to be conservative in decision-making for chemical sprays.
The BGRcast model was tested for its effectiveness in decision-making for bactericide sprays in the field. For this application, decision-support advisories for eight rice cultivars were evaluated using the data from 2001 and 2010. By selecting the eight rice cultivars transplanted at 30 May and 15 June under unfavorable and favorable weather conditions, we were able to examine 16 cases with different Cinc and Cinf. The results in Table 4 suggested that the recommendations based on Cinc and Cinf appeared reasonable considering disease incidence that actually occurred without any bactericide sprays in 2001 and 2010. In the conventional spray program adopted by rice growers in Korea, two sprays at the pre- and post-heading stage are commonly recommended and the first spray at the pre-heading stage is considered more important than the other (Hikichi and Egami, 1995; Isogawa et al., 1989; KCPA, 2014). In the cases of cultivars Sura, Shindongjin and Ilpum transplanted on 15 June, recommendation for just one spray at the pre-heading stage would be a safeguard for rice crop in 2001 considering the weather conditions prior to panicle emergence of the three cultivars. In 2010, it is interesting to note that disease incidence on early-transplanted cultivar Manna and late-transplanted cultivar Ilmi was close to 0% and the BGRcast model recommended just one spray at the post- and pre-heading stage, respectively. The savings of bactericide spray in the cases of cultivars Manna and Ilmi would be an advantage of implementing the BGR forecast model in 2010, during which weather conditions were generally favorable for the disease development. Consequently, the decision-making for bactericide sprays using the BGRcast model would be of help for rice growers to improve effectiveness of spray programs to control BGR. The thresholds of Cinc = 0.3 and Cinf = 0.5 were found to be appropriate in this study. Although multi-year data were used to determine the thresholds of Cinc and Cinf, further investigation is yet to be necessary to find an ideal threshold levels for common uses under various environmental conditions.
In this study, we have proposed Cinc and Cinf as a measure of conduciveness of weather conditions for population growth of B. glumae and panicle infection by the bacteria, respectively. Since Cinc and Cinf are calculated in relation to the first panicle emergence and the heading stage of rice plants, they can be used in comparative studies on BGR in the field. For example, it is difficult to evaluate disease resistance of rice cultivars with different heading stages in the field because difference in disease incidence of BGR may have been caused by differences in both disease resistance and weather conditions during the heading stages of rice cultivars. In this case, Cinc and Cinf can be used as a standardized measure of environmental effects on BGR development, so that the compounding effects due to differences in the heading stage could be eliminated.
In conclusion, the BGRcast model was found to be useful in identifying weather conditions conducive to BGR development based on daily minimum temperature and average relative humidity. The model was also able to determine whether to spray bactericides to control the disease. By defining three phases of epidemic development of BGR in relation to panicle emergence of rice plants, the BGRcast model could be used for diverse rice management systems regardless of rice cultivars and cropping systems. With the thresholds of Cinc = 0.3 and Cinf = 0.5, the model could be used to determine whether to spray bactericide at the pre- and post-heading stage sprays to improve effectiveness of the conventional spray program to control BGR. Further evaluation on the BGRcast model along with bactericide spray programs is necessary to implement the model for practical use by rice growers.

 PDF Links
 PubReader
 Full text via DOI
 Full text via PMC
 Download Citation
 Print
Print