Resistance Potential of Bread Wheat Genotypes Against Yellow Rust Disease Under Egyptian Climate
Article information
Abstract
Yellow rust (stripe rust), caused by Puccinia striiformis f. sp. tritici, is one of the most destructive foliar diseases of wheat in Egypt and worldwide. In order to identify wheat genotypes resistant to yellow rust and develop molecular markers associated with the resistance, fifty F8 recombinant inbred lines (RILs) derived from a cross between resistant and susceptible bread wheat landraces were obtained. Artificial infection of Puccinia striiformis was performed under greenhouse conditions during two growing seasons and relative resistance index (RRI) was calculated. Two Egyptian bread wheat cultivars i.e. Giza-168 (resistant) and Sakha-69 (susceptible) were also evaluated. RRI values of two-year trial showed that 10 RILs responded with RRI value >6 <9 with an average of 7.29, which exceeded the Egyptian bread wheat cultivar Giza-168 (5.58). Thirty three RILs were included among the acceptable range having RRI value >2 <6. However, only 7 RILs showed RRI value <2. Five RILs expressed hypersensitive type of resistance (R) against the pathogen and showed the lowest Average Coefficient of Infection (ACI). Bulked segregant analysis (BSA) with eight simple sequence repeat (SSR), eight sequence-related amplified polymorphism (SRAP) and sixteen random amplified polymorphic DNA (RAPD) markers revealed that three SSR, three SRAP and six RAPD markers were found to be associated with the resistance to yellow rust. However, further molecular analyses would be performed to confirm markers associated with the resistance and suitable for marker-assisted selection. Resistant RILs identified in the study could be efficiently used to improve the resistance to yellow rust in wheat.
Wheat is the most widely cultivated cereal crop in the world. In Egypt, it is considered as the major winter cereal crop and the third major crop in terms of area planted. Severe losses due to different wheat diseases including yellow rust, also known as stripe rust, have been reported (Kissana et al., 2003). Wheat yellow rust is one of the most devastating diseases of wheat worldwide. It is caused by the basidiomycete fungus Puccinia striiformis Westend. f. sp. tritici Eriks (Eriksson, 1894; Hassebrauk, 1965; Stubbs, 1985 and Hovmoller et al., 2010) and continues to cause severe damage worldwide (Chen et al., 2013). Biotrophic plant pathogens such as rust pathogens secrete an array of proteins, known as effectors, to modulate plant innate immunity and enable parasitic infection (Hogenhout et al., 2009). Yellow rust is a highly destructive disease threatening wheat production and quality worldwide. This is mainly due to the pathogen’s ability to mutate and multiply rapidly as well as to use its air borne dispersal mechanism from one field to another (Brown and Hovmøller, 2002; Watson and De Sousa, 1983).
Slow rusting, a form of quantitative resistance, prolongs the latent period of fungal infection and decreases disease severity (Rashid, 1997; Wang et al., 2000), can slow the incidence and development of stripe rust in the field, thus reducing yield losses and being of practical value. Slow rusting is thought to be a non-race-specific resistance that effectively controls the epidemic spread of stripe rust in a stable, sustained, and durable manner (Das et al., 1992). Among all the control measures of this disease, genetic resistance is the only economic and practical control measure, causing no additional cost to the farmer (Singh et al., 2004). Therefore, breeding for resistance to yellow rust and developing new resistant cultivars became the main target in wheat breeding programs and considered as the most economical and effective way to eliminate the use of fungicides and reducing crop losses caused by the disease. Afshari (2004) and Singh et al. (2004) reported that a new stripe rust race can attack wheat cultivars which possessing Yr27 resistance gene in India, Yemen, Egypt, Ethiopia, Eritrea, Tajikistan, Uzbekistan and Kyrgyzstan during previous years Thus, it is of great importance to develop wheat cultivars possessing new resistance genes for yellow rust.
A number of genes controlling yellow or stripe rust resistance in wheat has been identified (McIntosh et al., 2011). Moreover, genetic associations of various microsatellite or simple sequence repeats (SSR) and random amplified polymorphic DNA (RAPD) markers with stripe rust resistance genes have been reported in wheat (Akfirat et al., 2010; Bariana et al., 2002; Bariana et al., 2006; Chague et al., 1999; Khlestkina et al., 2007; Robert et al., 2000; Sun et al., 2002; Tabassum 2011; Wang et al., 2002; William et al., 2003; Wang et al., 2008). Identification of molecular markers associated with yellow rust resistance has facilitated the marker-assisted selection of the resistance genes in wheat breeding program. Furthermore, to ensure optimal cost-effectiveness, molecular markers used for marker-assisted selection should permit efficient screening of large populations (Huang and Röder, 2004). Bulked segregant analysis (BSA) is a highly efficient method developed firstly by Michelmore et al. (1991) for rapidly identifying markers linked to any specific gene or genomic region. The use of BSA in combination with PCR-based markers such as RAPD, SSR and SRAP markers has proven to be a very powerful technique for identifying molecular markers associated with a quantitative trait locus (QTL) or a gene of interest (Avila et al., 2003; Bakhit and Abdel-Fatah, 2013 and El-Sayed et al., 2013; Cho et al., 1996; Diaz-Ruiz et al., 2010; Nakamura et al., 2001; Rostoks et al., 2002; Shen et al., 2003; Torres et al., 2010).
In Egypt, a large number of wheat landraces have been preserved, which potentially possess many yellow rust resistance genes. Thus, it is of great importance to identify resistance genetic resources from the landraces and use them in wheat breeding programs aiming to develop improved varieties. In the present study, a population of fifty F8 recombinant inbred lines (RILs) derived from a cross between resistant and susceptible Egyptian bread wheat landraces was used to identify genotypes resistant to yellow rust, and to develop molecular markers associated with the disease resistance.
Materials and Methods
Plant material and greenhouse trials
The plant material utilized in the present study consisted of a population of fifty F8 recombinant inbred lines (RILs) derived from a cross between resistant and susceptible bread wheat landraces to yellow rust collected from farmers’ fields in Upper Egypt in 1993. Two Egyptian bread wheat cultivars i.e. Giza-168 (resistant) and Sakha-69 (susceptible) were used as controls.
The trials pertaining to screening different genotypes for their resistance against yellow rust were conducted at the greenhouse of Plant Pathology Department, Faculty of Agriculture, Assiut University, Egypt during 2011 and 2012. During this investigation, fifty two entries (fifty RILs and two Egyptian wheat cultivars) were sown at the greenhouse to observe the yellow rust response. A 6 seeds of each entry was planted in a sterilized pot (No.8) containing sterilized soil, supplemented with NPK at the ratio of 1%. Three replicates were made for each genotype. The plants were irrigated when necessary and daily observed for infection.
Collection of yellow rust samples and inoculation
Diseased leaf samples were collected from different cultivars and breeding lines from three different locations in Assiut Governorate, Egypt, namely Assiut, Manfalout and Abuteeg during 2011 and 2012 wheat growing seasons. Artificial inoculations were carried out using a spores mixture of the most prevalent yellow rust of the field collections in 2011 and 2012. Diseased leaf samples were placed on moist filter paper in a Petri dish that was kept at 10°C overnight. Urediniospores were collected from diseased leaf samples with the help of small brush. The inoculums were prepared immediately prior to use by suspending urediospores in a solution of diH2O and Tween-20, which 1 to 2 drops were added to break the surface tension. Spore suspension was prepared 0.6 ml per plant at concentration of 6×10⁵ spores/ml. Spray were apply on the plants on front and back from 6 inch away with one hand behind the plants to catch most of the inoculum on the plant. Inoculations were carried out in the early evening (after sunset). The inoculation of all plants was carried out at booting stage according to the method of Tervet and Cassell (1951).
Disease observation
Observations were recorded at the first appearance of stripe rust infection on the susceptible wheat lines. Observations on response and severity of stripe rust were recorded according to Loegering (1959) and Hussain (1997). Yellow rust severity (%) was recorded for each cultivar from the time of rust first appearance then every seven days until the early dough stage (Large, 1954). Estimates of severity were measured according to Modified Cobb Scale (Paterson et al., 1948), which is used to determine the percentage of possible tissue rusted and was evaluated from 1% to 100%. The severity was recorded as percent of rust infection on the plants (Fig. 1). As severity is determined by visual observation, readings cannot be absolutely correct. Therefore, below 5% severity, the intervals used are trace (T) to 2. Usually, 5 percent intervals are used from 5 to 20 percent severity and 10 percent intervals for higher readings.
Scale of rust severity (percent of leaf area infected).
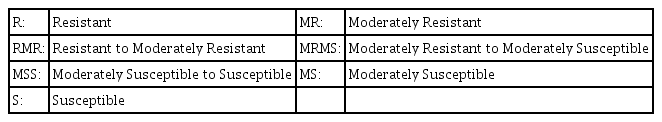
Readings of severity and reaction are recorded together with severity first as follow:
TR = Trace severity of resistant type infection
10MR = 10 percent severity of a moderately resistant type infection
30MS = 30 percent severity of a Moderately Susceptible type infection
50S = 50 percent severity of a susceptible type infection
Calculation for ACI and RRI
The Coefficient of Infection (CI) for stripe rust has been calculated according to (Akhtar et al., 2002) as shown in Table 1. Coefficient of Infection was calculated by multiplying the response value with the intensity of infection in percent. Average Coefficient of Infection (ACI) was derived from the sum of CI values of each entry divided by the number of tested years.

The observation on response of stripe rust
The highest ACI of a candidate line is set at 100 and all other lines are adjusted accordingly. This gives the Country Average Relative Percentage Attack (CARPA). The ‘0’ to ‘9’ scale previously designated as Resistance Index (R.I) has been re-designated as RRI (Relative Resistance Index). From CARPA, RRI was calculated on a 0 to 9 scale, where 0 denotes most susceptible and 9 denotes highly resistant (Akhtar et al., 2002). The RRI was calculated according to the following formula:
Bulked segregant analysis (BSA)
In order to identify molecular markers associated with the resistance against yellow rust in specific genomic regions, the F8 RILs population was subjected to BSA with three molecular marker systems including simple sequence repeat (SSR), sequence-related amplified polymorphism (SRAP) and random amplified polymorphic DNA (RAPD) markers. The BSA was performed at the Department of Genetics, Faculty of Agriculture, Assiut University in 2013.
Based on RRI value of the two-year trial for each RIL, seven resistant and seven susceptible contrasting genotypes selected from the RILs population were used to construct resistant and susceptible DNA bulks. DNA extraction from young and fresh leaves of each RIL was carried out according to the cetyltrimethylammonium bromide (CTAB) method for isolation of total genomic DNA from plants (Murray and Thompson, 1980) with some modifications. Aliquots of DNA from the two extreme groups of seven resistant and seven susceptible RILs were mixed to produce resistant and susceptible DNA bulks for BSA.
Molecular markers analysis
Resistant and susceptible DNA bulks were screened for differences using sixteen 10-mer RAPD primers (Operon, USA), eight SSR and eight SRAP makers. Primers sequences and PCR conditions of SSR markers were obtained by the GrainGenes database (http://wheat.pw.usda.gov). PCR amplifications were performed in 25 μl reaction mixtures, each containing 50–100 ng of genomic DNA, 1× PCR buffer, 2–4 mM MgCl2 (2 mM for SSR and 4 mM for RAPD and SRAP), 200 μM of each dNTP, 0.2 μM of each primer, and 1 U Taq DNA-polymerase. Amplifications were performed in a SensoQuest LabCycler (SensoQuest GmbH, Göttingen, Germany) using the following PCR profile: initial denaturation at 94°C for 5 min, followed by 45 cycles each consisting of 1 min at 94°C, 1 min at 34°C for RAPD, 40–45°C for SRAP and 50–55°C for SSR (depending on the suggested annealing temperature), followed by 2 min at 72°C, with a final extension at 72°C for 10 min. PCR products were separated using horizontal gel electrophoresis unit on 1.5% agarose gels for RAPD and 2.5% for SSR and SRAP in 0.5 × TBE buffer. A 100 bp DNA ladder was used to estimate the size of each amplified DNA fragment. The gel was run for approximately 2–3 hrs using constant voltage of around 80 V and then visualized and photographed under UV light. Putative polymorphisms among the two bulks were detected for each marker separately.
Results
In the present study, a total number of fifty F8 RILs derived from a cross between resistant and susceptible bread wheat landraces, and two Egyptian bread wheat cultivars i.e. Giza-168 (resistant) and Sakha-69 (susceptible) were evaluated for yellow rusting resistance under artificial infection at Plant Pathology Department, Faculty of Agriculture, Assiut University, Egypt. The following parameters were used to assess yellow rusting at both tested years: Disease Reaction (DR), Coefficient of Infection (CI), Average Coefficient of Infection (ACI) and Relative Resistance Index (RRI).
Disease reaction (DR)
Of 50 RILs, 3 (6%) RILs (i.e. RIL-3, RIL-4 and RIL-15) showed Susceptible (S) symptoms (Average Coefficient of Infection 90–100%), 4 (8%) RILs (i.e. RIL-7, RIL-13, RIL-14 and RIL-17) showed Moderately Susceptible (MS) symptoms (ACI 80–<90%), 17 (34%) RILs showed Moderately Susceptible to Susceptible (MSS) symptoms (ACI: 60–<80%), 12 (24%) RILs showed Moderately Resistant to Moderately Susceptible (MRMS) symptoms (ACI: 40–<60%), 5 (10%) RILs showed Resistant to Moderately Resistant (RMR) symptoms (ACI: 30–<40%), 4 (8%) RILs (i.e. RIL-27, RIL-28, RIL-44 and RIL-47) showed Moderately Resistant (MR) symptoms (ACI: 20–<30%) and 5 (10%) RILs (i.e. RIL-31, RIL-32, RIL-42, RIL-43 and RIL-48) were Resistant (R) (ACI 5–<20%). The Average Coefficient of Infection of the two Egyptian bread wheat cultivars Giza-168 (resistant) and Sakha-69 (susceptible) were 38 and 81%, respectively (Table 2).
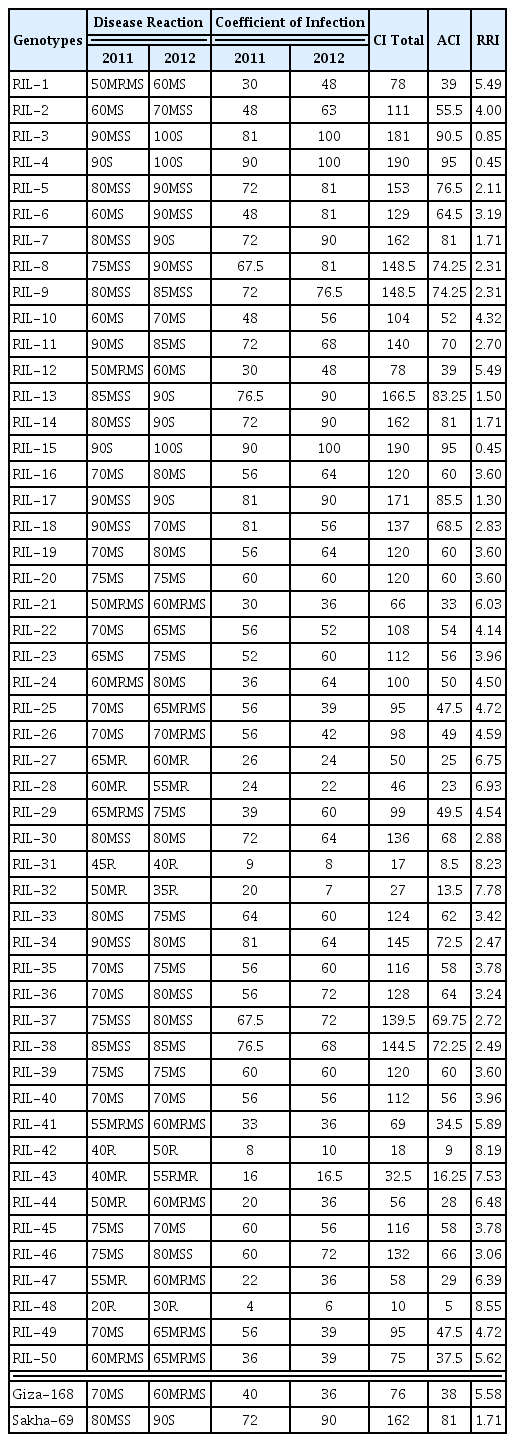
Response of fifty RILs and two Egyptian bread wheat cultivars (Giza-168 and Sakha-69) to yellow rust infections during 2011and 2012
Relative resistance index (RRI)
Frequency distribution of RRI values of the two-year trial for 50 F8 RILs is presented in Fig. 2. The distribution was continuous and approached normality, indicating a quantitative type of inheritance, and thereby RRI is under the control of multiple genes. Based on the RRI values (Table 2), among the 50 tested RILs, 9 RILs (i.e. RIL-27, RIL-28, RIL-31, RIL-32, RIL-42, RIL-43, RIL-44, RIL-47 and RIL-48) had expressed resistant (R) to moderately resistant (MR) type of reaction. These genotypes were having highest relative resistance index (RRI) of yellow rust resistance, which exceeded the resistant cultivar Giza-168 (5.58). The RRI for mentioned seven RILs were: 6.75, 6.93, 8.23, 7.78, 8.19, 7.53, 6.48, 6.39 and 8.55 respectively (Fig. 3, Table 2). Maximum stripe rust severity was recorded in RIL-3, RIL-4 and RIL-15 with RRI of 0.85, 0.45, and 0.45, respectively, which was in magnitude smaller than the susceptible wheat cultivar Sakha-69 (1.71) (Table 2).
Frequency distribution of relative resistance index (RRI) in a population of 50 F8 RILs evaluated during two years (where, 0 denotes most susceptible and 9 denotes highly resistant).

Histograms depicting RILs used to create: (A) resistant and (B) susceptible bulks.
Yellow rust severity (%)
The yellow rust severity recorded for the susceptible RILs and the two Egyptian cultivars estimated for two years (Table 2) revealed that, none of the investigated RILs having (0%) severity. Among the 50 tested RILs, yellow rust severity in 2011 was maximum (90%) for RIL-3, RIL-4, RIL-11, RIL-15, RIL-17, RIL-18 and RIL-34; and minimum (20–50%) for RIL-1, RIL-12, RIL-21, RIL-31, RIL-32, RIL-42, RIL-43, RIL-44 and RIL-48.
In 2012, the maximum severity for the tested RILs was (90–100%) in RIL-3, RIL-4, RIL-5, RIL-6, RIL-7, RIL-8, RIL-13, RIL-14, RIL-15, RIL-17 and Sakha-69. The minimum yellow rust severity was (30–50%) in RIL-31, RIL-32, RIL-42 and RIL-48.
Bulked segregant analysis (BSA)
For identification of molecular markers associated with yellow rust resistance, resistant and susceptible DNA bulks were screened for differences using sixteen 10-mer RAPD primers (Operon, USA), eight SSR and eight SRAP makers.
SSR markers
Out of eight SSR markers tested, three SSRs (37.5%) namely Xgwm339, Xgwm493 and Xwmc398 located on chromosomes 2AS, 3BS and 6BS, respectively, distinguished resistance from susceptible bulks (Fig. 4) and generated a total number of 39 bands ranged from 9 (Xgwm493-3BS) to 16 (Xwmc398-6BS) with an average of 13 bands per marker. Of the 39 bands amplified with 3 SSRs, 17 bands (43.6%) were polymorphic (Table 3) with an average of 5.7 polymorphic bands per marker. The lowest polymorphism between the two bulks (22.2%) was obtained with Xgwm493-3BS, whereas the highest polymorphism (64.3%) was produced with Xgwm339-2AS (Table 2).
DNA amplification patterns obtained using bulked segregant analysis with 8 SSR markers. M is the 100 bp DNA ladder, RB the resistant bulk, SB the susceptible bulk. Differences between the two bulks were detected using Xgwm339-2AS, Xgwm493-3BS and Xwmc398-6BS. Arrows indicate polymorphic bands obtained which distinguished the resistant from the susceptible bulk.
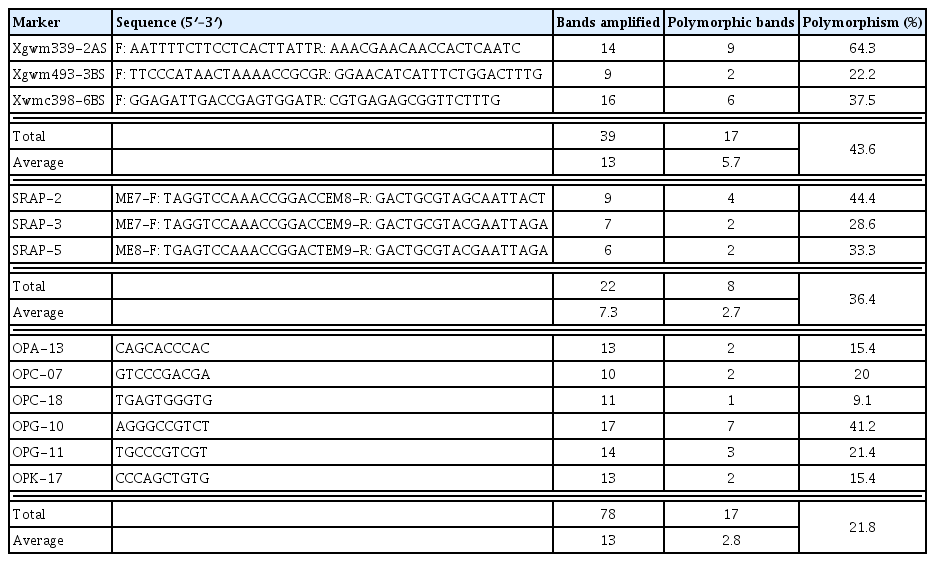
Polymorphism detected between resistant and susceptible bulks by the use of three SSR, three SRAP and six RAPD markers
SRAP markers
Among the eight SRAP markers screened, three (37.5%) SRAPs showed polymorphism between resistance and susceptible bulks (Fig. 5). The three markers generated a total of 22 bands with an average of 7.3 bands per marker which ranged from 6 bands for SRAP-5 to 9 bands for SRAP-2 (Fig. 5, Table 3). Of these 22 bands generated with three SRAPs, 8 bands (36.4%) were polymorphic with an average of 2.7 polymorphic bands per marker. The highest polymorphism (44.4%) was observed with SRAP-2, whereas 28.6% and 33.3% polymorphism was obtained by SRAP-3 and SRAP5, respectively.
DNA amplification patterns obtained using bulked segregant analysis with 8 SRAP markers. M is the 100 bp DNA ladder, RB the resistant bulk, SB the susceptible bulk. Differences between the two bulks were detected using SRAP-2, SRAP-3 and SRAP-5. Arrows indicate polymorphic bands obtained which distinguished the resistant from the susceptible bulk.
RAPD markers
Out of 16 RAPD primers tested, 6 RAPD primers (37.5%) showed polymorphic amplification patterns which distinguished resistance from susceptible bulks (Fig. 6). Individual primers produced bands in a range of 10 (OPC-07) to 17 (OPG-10), with an average of 13 bands per marker. Of the 78 bands amplified with 6 primers, 17 bands (21.8%) were polymorphic (Table 3) with an average of 2.8 polymorphic bands per marker. Polymorphic bands for individual primers ranged from a unique band (9.1%), which was present only in the resistance bulk, with OPC-18 to 7 bands (41.2%) with OPG-10. These bands could be considered as specific markers for yellow rust resistance in wheat.
DNA amplification patterns obtained using bulked segregant analysis with 16 RAPDs markers. M is the 100 bp DNA ladder, RB the resistant bulk, SB the susceptible bulk. Differences between the two bulks were detected using OPA-13, OPC-07, OPG-10, OPG-11, OPK-17 and OPC-18. Arrows indicate polymorphic bands obtained which distinguished the resistant from the susceptible bulk.
Discussion
Tolerance to yellow rust is one of the most important objectives of wheat breeding programs in all wheat growing regions of the world (Akfirat et al., 2010). Wheat landraces from diverse geographic regions are a potential source of novel rust resistance genes for developing new and diverse resistant germplasm (Sthapit et al., 2014). A large number of wheat landraces have been preserved in Egypt, which possessed abundantly genetic diversity including many yellow rust resistance genes. Therefore, it is of great importance to identify resistance genetic resources from the landraces to be used in wheat breeding programs aiming to develop improved varieties. In the present study, a population of fifty F8 RILs derived from a cross between resistant and susceptible Egyptian bread wheat landraces was evaluated for yellow rust resistance under greenhouse conditions during two growing seasons. RRI values of two-year trial (Table 2) revealed that, among the 50 tested RILs, 5 RILs (RIL-31, RIL-32, RIL-42, RIL-43 and RIL-48) expressed hypersensitive type of resistance against the pathogen and 4 RILs (i.e. RIL-27, RIL-28, RIL-44 and RIL-47) had expressed moderately resistant type of reaction. These genotypes were having highest RRI which exceeded the resistant cultivar Giza-168, suggesting that resistant genotypes are expected to possess diverse resistance genes and could be efficiently used as parents to improve resistance to yellow rust in breeding programs.
Bulked segregant analysis in combinations with three molecular markers systems revealed that out of eight SSR and eight SRAP and sixteen RAPD markers tested, three SSR, three SRAP and six RAPD markers distinguished resistance from susceptible bulks and were found to be putatively associated with the resistance to yellow rust. Therefore, these markers could be useful as a base for marker-assisted selection program aiming to improve yellow rust resistance in wheat. In accordance with these results, genetic associations of various SSR and RAPD markers with stripe or yellow rust resistance genes have been reported in wheat (Akfirat et al., 2010; Bariana et al., 2002; Bariana et al., 2006; Chague et al., 1999; Khlestkina et al., 2007; Robert et al., 2000; Sun et al., 2002; Tabassum, 2011; Wang et al., 2002; Wang et al., 2008; William et al., 2003). When utilizing BSA in segregating populations with minimal gene distortion, the likelihood of falsely identifying linked markers to the target gene is minimized; therefore, fewer individuals are required per bulk (Lin et al., 2006). Thus, BSA can provide fast detection of molecular markers linked to genes of interest. RAPD analysis in combination with BSA has been long used to identify molecular markers linked to genes of interest (Bakhit and Abdel-Fatah, 2013; Chague et al., 1997; Mackay and Caligari, 2000; Lin et al., 2006; Michelmore et al., 1991; Zhang et al., 1994). SRAP is an efficient molecular technique with the marker behaves as codominant and more reproducible than RAPD (Li and Quiros, 2001). However, unlike RAPD and SRAP, SSRs reported firstly in plants by Condit and Hubbel (1991) are PCR-based markers characterized by a high level of polymorphism that permits to discriminate among cultivars and even among closely related wheat breeding lines (Maccaferri et al., 2007; Mantovani et al., 2008). Moreover, SSRs are locus-specific, codominant markers evenly distributed over the genome and require only small amounts of genomic DNA for analysis which are particularly useful for mapping and genetic analysis. A large number of SSR markers are already available for several important agricultural crops including wheat (Gupta and Varshney, 2000; Mantovani et al., 2008; Röder et al., 1998; Somers et al., 2004; Sourdille et al., 2004; Wang et al., 2007). The 2013 Catalogue of Gene Symbols for Wheat (McIntosh et al., 2013) and the 2013–2014 Supplement include 67 officially named Yr genes (Yr1 to Yr67) designated for the resistance to stripe rust and 42 with temporary Yr designations. Furthermore, over 140 QTLs for resistance to yellow rust in wheat have been published and through mapping flanking markers on consensus maps, 49 chromosomal regions are identified (Rosewarne et al., 2013). In the present study, we identified three SSR markers associated with the resistance to yellow rust in bread wheat; namely Xgwm339, Xgwm493 and Xwmc398 located on chromosomes 2AS, 3BS and 6BS, respectively. Accordingly, many of previously reported Yr genes, QTLs and SSR markers associated with the resistance to yellow rust in wheat were located on chromosomes 2A, 3B and 6B (McIntosh et al., 2013; Rosewarne et al., 2013). Chromosome 2A has one region associated with the resistance on the short arm (2AS) and another region on the long arm (2AL). The region around the 2AS QTL (QRYr2A.1) are associated with the major, race-specific seedling resistance gene Yr17 (Rosewarne et al., 2013), while a major QTL for adult-plant resistance (QYr.osu-2A) was located on chromosome 2AS by Fang et al., 2011. The 3B chromosome appears to have at least three regions associated with stripe rust resistance. The majority of QTLs identified on 3B are on the short arm (3BS) and it is interesting that Xgwm493 was mapped into QRYr3B.1 region on 3BS which is known to be extremely important as it is the location of Yr30 gene, and it has a consistent intermediate effect on stripe rust and is fairly consistent across environments (Rosewarne et al., 2013). The temporarily designated gene Yrns-B1 on 3BS, which identified as non-race specific adult-plant resistance gene against stripe rust, was located in a 3 cM interval between Xgwm493-3B and Xgwm1329-3B (McIntosh et al., 2013). Recently, Zhou et al., 2014 reported that, the recessive gene Yrwh2 is located on chromosome 3BS and it is different from previously reported stripe rust resistance genes Yr30, QYr.ucw-3BS, Yrns-B1, YrRub and QYrex.wgp-3BL previously mapped on chromosome 3B. They also suggested that Yrwh2 and its closely linked markers are potentially useful for developing stripe rust resistance wheat cultivars if used in combination with other genes. Lowe et al., 2011 reported that the gene underlying QYr.ucw-3BS appears to be different from Yr30 and Yrns-B1 genes. The QYr-ucw.3BS was mapped 3.6 cM distal of Xgwm493 by Lowe et al., 2011, whereas the adult plant resistance gene Yrns-B1 was mapped 2.5 cM proximal of Xgwm493 (Borner et al., 2000; Khlestkina et al., 2007). However, Zhou et al., 2014 could not determine the distance between Yrwh2 and Xgwm493 as the marker was not polymorphic. Similarly, chromosome 6A had three clearly defined regions associated with stripe rust resistance and these are likely to be conferred by three distinct genes (Rosewarne et al., 2013). The first region (QRYr6B.1) is at the telomere of 6AS. Generally, molecular markers tightly linked to target genes can provide a useful tool in plant breeding since they can used to detect tolerant genes of interest without the need of carrying out field evaluations. Moreover, the use of molecular markers can increase the efficiency of conventional plant breeding by identifying markers linked to the trait of interest which are difficult to evaluate and/or are largely affected by the environment. Screening a large number of breeding materials or populations at early growth stages and in a short time could be also performed using molecular markers. Therefore, it is urgent to identify new genes for resistance to yellow rust and to develop molecular markers for efficient incorporation and pyramiding of new genes into wheat cultivars (Zhou et al., 2014). Consequently, SSR markers identified in the present study (i.e. Xgwm339-2AS, Xgwm493-3BS and Xwmc398-6BS) which showed the highest polymorphism (43.6%) than SRAPs (36.4%) and RAPDs (21.8%) could be efficiently used for marker-assisted selection of yellow rust resistance in wheat breeding programs. Moreover, it is likely that resistant RILs identified in the present study contain potentially some adult plant resistance genes. For example, the non-race specific adult-plant resistance gene (Yrns-B1) which was identified previously as located on 3BS and linked to Xgwm493-3BS could be present within the resistant RILs. Furthermore, some seedling and/or adult plant resistance genes on 2AS and 6BS may also be present. In addition, diseased leaf samples were collected from different cultivars and breeding lines across different locations, thereby there is a possibility of the presence of more than one pathotype. Therefore, it is likely that interaction between disease resistance genes could also be present. Subsequently, resistant RILs identified in the current study could be efficiently used to develop improved varieties in wheat breeding programs. However, further molecular analyses of the whole RIL population with co-segregating markers would be performed to confirm markers associated with the resistance and suitable for marker-assisted selection.
In conclusion, resistant RILs identified in the present study are expected to possess diverse resistance genes and could be efficiently used as parents to improve resistance to yellow rust in wheat breeding programs. Molecular markers identified in the study using BSA, once verified by genotyping the whole RILs population, could allow implementation of marker-assisted selection for incorporating desirable resistant genotypes in wheat breeding programs. Furthermore, SSRs are likely to be the most effective markers used in the study.