Spatial and Temporal Genetic Diversity and Population Structure of Hemileia vastatrix from Peruvian Coffee Plantations
Article information

Abstract
Population genetic studies of Hemileia vastatrix have been conducted in order to describe the evolutionary dynamics of the pathogen and the disease epidemiology as consequence of changes in disease management and host distribution occurred in Peru after the 2013 epidemic. These analyses were performed by sequencing the internal transcribed spacers of the nuclear ribosomal DNA (rDNA-ITS) of H. vastatrix collected from two coffee growing areas in 2014 and 2018. H. vastatrix population showed high haplotype diversity (Hd = 0.9373 ± 0.0115) with a low nucleotide diversity (π = 0.00322 ± 0.00018). Likewise, AMOVA indicated that fungus population has behaved as a large population without structuring by geographical origin and sampling years (FST = 0.00180, P = 0.20053 and FST = 0.00241, P = 0.19693, respectively). Additionally, the haplotype network based on intraspecific phylogenetic analysis of H. vastatrix using Peruvian and NCBI sequences revealed that Peruvian ancestral haplotypes, which were maintained in time and space, would correspond to the reported sequences of the races II and XXII. This result suggests that no substantial changes have occurred through time in Peruvian Hemileia vastatrix population.
Coffee leaf rust, caused by the biotrophic fungus Hemileia vastatrix Berkeley and Broome (1869), is considered as the most devastating disease for coffee cultivars around the world. In 1869, it was responsible for the replacement of Coffea arabica varieties with tea bushes (Camellia sinensis) in Sri Lanka. A century later, in 1970, the disease was reported for the first time in the western hemisphere in the state of Bahia in Brazil by plant pathologist Arnaldo Medeiros (Schieber and Zentmyer, 1984) and currently is widely distributed in all coffee producing countries around the world (Talhinhas et al., 2017). Despite the fact that in Peru the coffee leaf rust was reported for the first time in 1979 (Schieber and Zentmyer, 1984), it did not cause substantial losses of coffee bean production until 2013, when the disease had the highest incidence and caused losses that reached 27% of the production in relation to 2011 (INEI, 2014). The same phenomenon had already been reported between 2008 and 2013 in other Latin American countries such as Colombia, Mexico and Ecuador (Avelino et al., 2015). The factors that triggered the emergence of the last epidemic in Latin America are not exactly known. Nevertheless, Avelino et al. (2015) suggested a circumstantial combination of economic, meteorological, agronomic and productivity factors. In Colombia, Rozo et al. (2012) also suggested that the origin of the coffee leaf rust epidemic that arose in 2008 was related to environmental conditions that favored disease development. Notwithstanding, the emergence of a new fungus variant was suggested as the main factor that caused the epidemic (Rozo et al., 2012).
Previous studies in population genetics showed that H. vastatrix has characteristics of a large population, with a high probability for new fungus variants to arise by rapid multiplication and mutation events (McDonald and Linde, 2002). Additionally, they showed that the pathogen has high mutation rate and adaptive capacity (Cabral et al., 2009, 2016; Cristancho et al., 2007; Maia et al., 2013; Porto et al., 2019). These features allow it to quickly break the resistance of coffee cultivars derived from the Timor Hybrid (HDT) (Diniz et al., 2012), which is a resistant natural hybrid between C. arabica and C. canephora (Lashermes et al., 1993) widely used in coffee breeding programs in the world (Gichuru et al., 2012; Zambolim, 2016). The selection pressure, exerted against H. vastatrix by resistant genotypes, has led to the emergence of more than 50 physiological races (Talhinhas et al., 2017; Zambolim, 2016) with increased complexity. For instance, the race XXXIII recently identified in Brazil has overtaken the rust resistance of the major coffee varieties used as parental donors in coffee breeding programs of this country (Porto et al., 2019).
In Peru after the 2013 coffee leaf rust epidemic a high haplotype diversity has been reported in H. vastatrix population (Quispe-Apaza et al., 2017). Moreover, there was a significant change in the frequency and distribution of the resistant coffee cultivars (Díaz and Carmen, 2017). The latter is due to the coffee plantation renewal plan implemented by the Peruvian government to fight coffee leaf rust. The selection pressure exerted by the resistant genes of these coffee cultivars on the high haplotype diversity of H. vastatrix population could result in the emergence of the new pathogens variants. Therefore, there is currently a high probability for new variants of the pathogen to arise. Thus, the study of genetic diversity and structure of plant pathogen populations is very important for the development of disease control strategies, monitoring the pathogen evolution and the fungus epidemiology (Cabral et al., 2016). Hence, this study has analyzed the genetic diversity and population structure of H. vastatrix by sequencing the internal transcribed spacers of the nuclear ribosomal DNA (rDNA-ITS), also considering the geographic origin and the sampling years to determine changes in the pathogen population dynamic after 2013.
Materials and Methods
Geographical origin of host
Coffee leaves infected by Hemileia vastatrix were sampled from plantations randomly selected in the coffee producing areas of Quillabamba (Cusco) and Villa Rica (Pasco), which are geographically separated and are considered major high coffee producing areas in Peru (Fig. 1).

Peruvian locations where coffee leaves with coffee rust were collected.
Fungal material
Twenty-five coffee leaves infected by Hemileia vastatrix from “Typica” and “Caturra” varieties were sampled at random in each of coffee plantations. The sampling was repeated twice, the first in 2014 (after coffee leaf rust epidemic) (Quispe-Apaza et al., 2017) and the second in 2018 (four years after the first sampling).
In Quillabamba sampling of infected leaves was carried out for both years in five plantations. In Villa Rica, sampling was made in six plantations in 2014, whereas it was only performed in one plantation at two different altitudes in 2018, because of shortage of infected coffee plants as a consequence of coffee plantations renewal plan (substitution of susceptible cultivars by new resistant). Based on collection sites, urediniospores were bulked in subpopulations according to Santana et al. (2018). In total data of 18 subpopulations were analyzed, 7 of which correspond to this study and 11 to those previously obtained in 2014 (Quispe-Apaza et al., 2017) (Table 1).
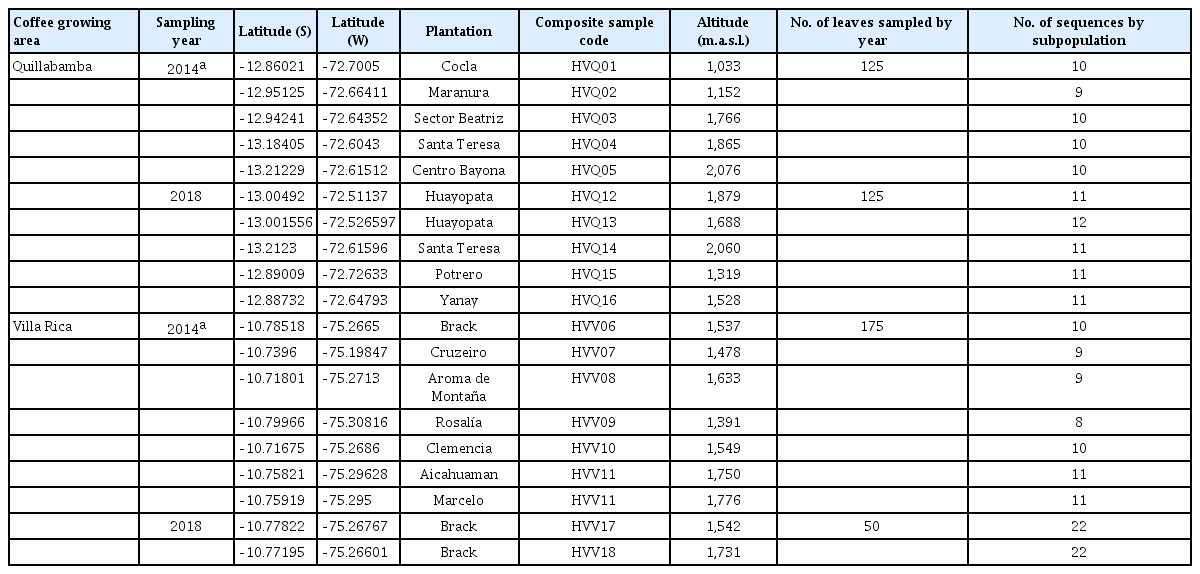
Georeferenced information of the farms where leaves with Hemileia vastratrix urediniospores were collected from coffee plants in Quillabamba and Villa Rica
DNA isolation, quality and quantification
Genomic DNA was extracted from 30-50 mg of urediniospores of each subpopulation using the protocol described by Cristancho et al. (2007), with modifications (Quispe-Apaza et al., 2017). The DNA quality was determined by electrophoresis in 1% agarose gel, stained with GelRed (Biotum) and visualized under UV light using UVP UVsolo Touch (Thermo Fisher Scientific, Waltham, MA, USA). DNA was quantified with spectrophotometer Epoch (BioTek Instruments, Inc., Winooski, VT, USA).
PCR and Escherichia coli genetic transformation
The rDNA-ITS regions were amplified by PCR using universal primers ITS1 (5′-TCCGTAGGTGAACCTGCGG-3′) and ITS4 (5′-TCCTCCGCTTATTGATATGC-3′) (White et al., 1990). The amplifications were performed in a total volume of 10 µl containing 1× PCR Taq buffer, 2 mM of deoxynucleotide triphosphates (dNTPs), 0.4 µM of each primer, 1.5 U of Taq polymerase and 40 ng of DNA. The amplification program was carried out with the following thermal profile: an initial denaturation at 95°C for 5 min, followed by 30 cycles of denaturation at 94°C for 1.5 min, annealing at 60°C for 1 min and extension at 72°C for 2 min, and one final extension cycle at 72°C for 5 min.
The amplified products were resolved by electrophoresis in 1% agarose gels. DNA bands corresponding to H. vastatrix ITS regions, approximately 1,000 bp long (Santana et al., 2018) were excised from agarose gel and purified using “QIAquick gel extraction Kit” (Qiagen, Hilden, Germany). Ligation reactions and competent DH5α cell transformations were performed using the pGEM-T Easy Vector System kit (Promega, Madison, WI, USA). Twelve to twenty-five transformed colonies were selected from each plate, which corresponds to one H. vastatrix subpopulation. Plasmid DNA from each colony was isolated from 5 ml of Luria-Bertani culture medium containing ampicillin (100 µg/µl) using the Wizard Plus SV Minipreps DNA Purification System kit (Promega). Transformation was verified by EcoRI digestion, visualized by electrophoresis in 1.5% agarose gel. From 111 isolated plasmids, 100 appeared to contain an insert and were then sent for sequencing to Macrogen (Seoul, Korea). Two hundred and six sequences were analyzed in total, 106 of which correspond to the data generated in 2014 (Quispe-Apaza et al., 2017) (Table 1).
Data analysis
Sequences corresponding to ITS1-5.8S-ITS2 and 28S regions were edited using CodonCode Aligner software v. 2.0.6, their aligning was carried out with MAFFT software implemented on UGENE platform (Golosova et al., 2014). Afterwards, all polymorphic positions were visually inspected to edit the final alignments by Aliview software v. 1.22 (Larsson, 2014). Sequences of ITS were deposited in GenBank (MW477031-MW477236).
Standard diversity indices such as haplotype number (H), polymorphism (S), haplotype diversity (Hd), and nucleotide diversity (π) (Nei and Li, 1979) were calculated with DnaSP v. 6 software (Rozas et al., 2017), excluding gap sites.
Tajima’s D (Tajima, 1989), Fu and Li’s D* and F* (Fu and Li, 1993) and Fu’s Fs (Fu, 1997) were calculated to detect deviations from a neutral Wright-Fisher model using DnaSP v. 6 software (Universitat De Barcelona, Barcelona, España). Likewise, mismatch distribution analysis was carried out, based on the Growth-Decline model, using DnaSP v. 6 software (Rozas et al., 2017). Distribution of the genetic variability and fixation indices were calculated by the analysis of molecular variance (AMOVA) using Arlequin software v. 3.5 (Excoffier and Lischer, 2010) by grouping the populations firstly by geographic origin and then by sampling year. The correlation between genetic and geographic distance among H. vastatrix samples was analyzed using the Mantel test (Mantel, 1967) with 9,999 permutations, by the ade4 package (Chessel et al., 2004) implemented in the R program (R Development Core Team, 2014). The geographic distance matrix was generated by calculating the distance between sampling areas of H. vastatrix using geographic coordinates system, then this was compared with the genetic distance matrix, which was performed by NT93 substitution model (Tamura and Nei, 1993).
Analysis of the intraspecific phylogenetic relationship of rDNA-ITS sequences of H. vastatrix, from two coffee producing areas in Peru and those reported by the National Center for Biotechnology Information (NCBI) (Table 2) (Cristancho et al., 2007; Santana et al., 2018), was performed by a haplotype network built using a median joining algorithm (Bandelt et al., 1999), implemented in the PopArt program (Leigh and Bryant, 2015).

List of rDNA-ITS sequences of Hemileia vastatrix populations that were used in the phylogenetic relationship analysis
Results and Discussion
Hemileia vastatrix genetic diversity
The alignment of 206 sequences corresponding to the ITS1, 5.8S, ITS2, and 28S regions of rDNA resulted in 918 aligned sites, of which 35 were informative and 145 singletons (Table 3). 116 haplotypes were then generated, based on these polymorphisms, six of which (5.17%) were shared between Quillabamba and Villa Rica, while only two (1.72%) were found in 2014 and 2018 as well. 87.07% of haplotypes were unique and exclusive to a single population while the nine remaining haplotypes (7.76%) were formed by two sequences.

Polymorphism of rDNA-ITS sequences, genetic diversity and neutrality tests of Hemileia vastatrix from two Peruvians coffee growing areas and two sampled years
The nucleotide diversity was low, both for the whole population (πTotal = 0.00322 ± 0.00018) and when the geographical origin and the sampling year were considered (πQuillabamba = 0.00406 ± 0.00026; πVilla Rica = 0.00292 ± 0.00023; π2014 = 0.00301 ± 0.00024; π2018 = 0.00397 ± 0.00026). However, the haplotypic diversity was high, either in the total population (HdTotal = 0.9373 ± 0.0115) and when the geographical origin and the sampling year were considered (HdQuillabamba = 0.954 ± 0.013 and HdVilla Rica = 0.933 ± 0.017; Hd2014 = 0.934 ± 0.017 and Hd2018 = 0.948 ± 0.014) (Table 3).
These results suggest that H. vastatrix population has low values of nucleotide diversity but high values of haplotypic diversity. Althoff and Pellmyr (2002) indicated that this fact characterizes a population that has undergone a genetic bottleneck and rapid population growth. The high proportion of singletons can explain the high haplotypic diversity. These results were also observed by Santana et al. (2018) in a H. vastatrix population from Brazil by rDNA-ITS sequencing. Similarly, Silva et al. (2018) reported a high proportion of singletons in a world collection of 37 H. vastatrix samples by restriction site associated DNA sequencing (RADseq). The presence of a high number of singletons in different H. vastatrix populations reinforces the idea that mutations are an important source in generating genetic variability. However, mechanisms causing genetic variability in this fungus are not entirely known yet. Therefore, spontaneous mutations should be considered as the main mechanism responsible for genetic variability in this pathogen (Santana et al., 2018). On the other hand, cryptosexuality could also explain the frequent and rapid emergence of new fungus variants (Carvalho et al., 2011). Notwithstanding, some molecular studies did not detect recombination and support the asexual status of H. vastatrix (Rozo et al., 2012), whereas others found evidence of recombination among fungus isolates under certain specific conditions (Cabral et al., 2016; Maia et al., 2013). Likewise, in the absence of sexual reproduction, which is still a debatable topic, hybridization between divergent isolates (Silva et al., 2018), parasexuality (Carvalho et al., 2011; Wang and McCallum, 2009) and transposons activity (Cristancho et al., 2014; Porto et al., 2019) could also be playing an important role in generating genetic variability in H. vastatrix.
H. vastatrix is characterized by a high production of spores per lesion (from 300,000 to 2 million in five months) (McCain and Hennen, 1984), therefore there is a high probability that new mutations arise in stages of high incidence of the disease, which would generate new alleles, increasing the observed genetic variability in the pathogen. Despite the decrease in the use of susceptible cultivars occurred between 2014 and 2017 in Quillabamba (from 89.4% to 42.2%) and Villa Rica (from 88.6% to 21.1%) and the use of fungicides to control the disease (implemented by the Ministry of Agriculture and Irrigation, SENASA 2018, unpublished data), a severe genetic diversity reduction in pathogen population was not observed through the years. This may be explained by the persistence of susceptible C. arabica varieties, which represent a constant source of inoculum for disease development (Maia et al., 2013).
Demographic history of H. vastatrix population
Negative values of statistics that assess the neutrality were found in the total population, showing a significant deviation from the neutrality. The negative value of the Tajima’s statistic D (D = ‒2.85942, P < 0.001) (Tajima, 1989) suggests a population expansion or purified selection. Similarly, D* and F* statistics showed negative values (D* = ‒11.09888, P < 0.02; F* = ‒8.48704, P < 0.02) revealing an excess of haplotypes that would have recently arisen due to the occurrence of population expansion or background selection (Fu and Li, 1993). Equally, the Fs of Fu statistic (Fs = ‒33,181) was negative (Table 3) suggesting a population expansion or a genetic hitchhiking (Fu, 1997). Likewise, the mismatch distribution analysis showed a unimodal distribution and a perfect fit to the expected distribution under the Growth-Decline population model (Fig. 2). These results, reflected in negative values of the three neutrality tests (Tajima’s D-statistic, Fu’s Fs test, and Fu and Li’s D* and F* values), reveal that an excess of haplotypes would have recently originated and suggest that a sudden population expansion has occurred. Moreover, these values suggest that fungus populations would have originated from a few genotypes that were recently introduced (Founder effect), or that they would be descendants of race II, which, according to Schieber and Zentmyer (1984), has existed in Peru since 1979 (Quispe-Apaza et al., 2017). These negative values of the neutrality tests would also explain the presence of a high number of unique haplotypes in the haplotype network, all of which increase the H. vastatrix variability (Fig. 3) and are probably the result of accelerated population growth. Therefore, we suggest that each infectious outbreak of the coffee leaf rust in the two coffee growing areas of Peru started from a few H. vastatrix genotypes.

Mismatch distribution for all pairwise combination of 206 rDNA-ITS sequences of Hemileia vastatrix, the dashed line shows expected frequencies and the solid line shows observed frequencies, under growth and decrease model. rDNA-ITS, internal transcribed spacers of the nuclear ribosomal DNA.
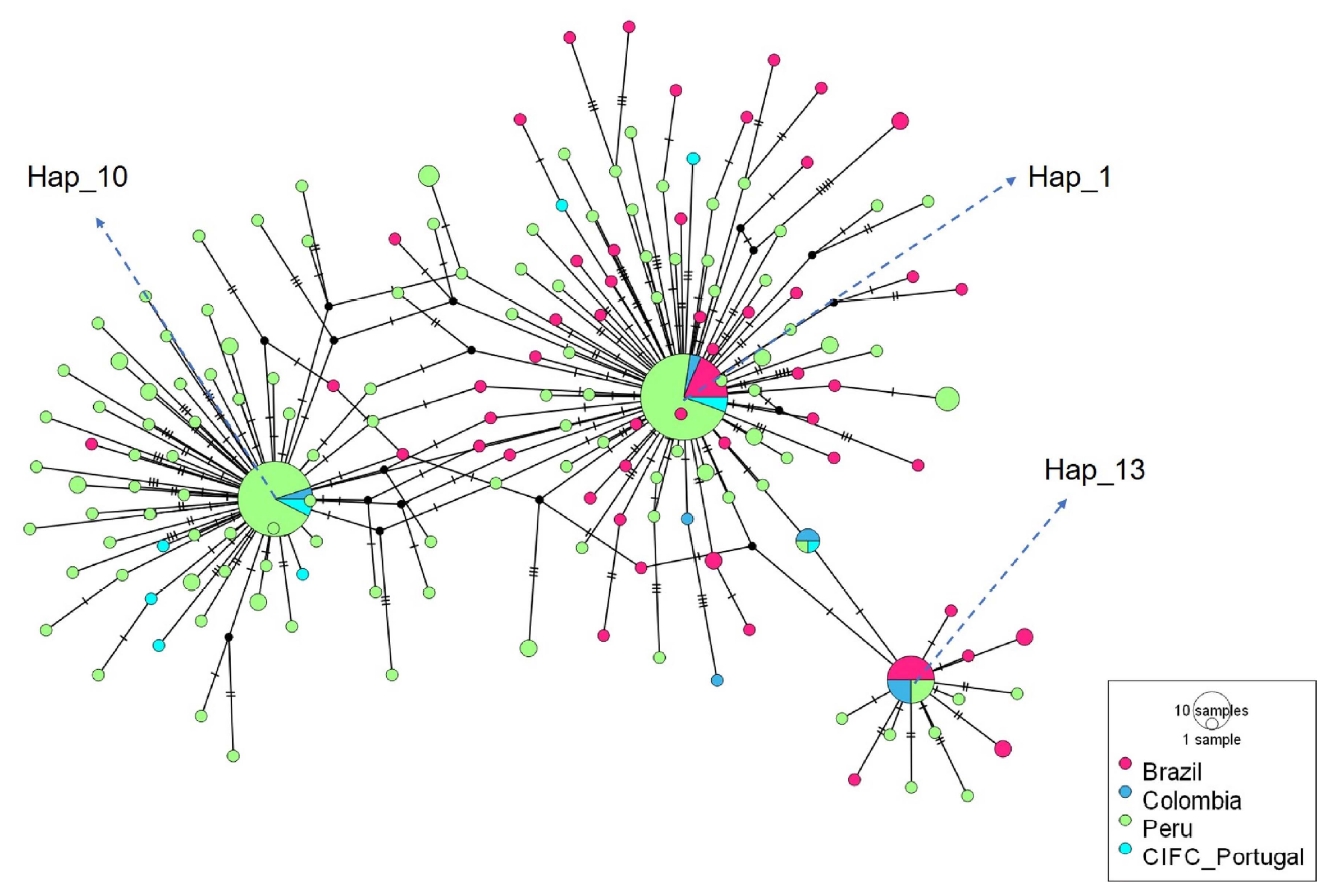
Haplotype network, constructed using the median joining method, from 174 haplotypes detected for the rDNA-ITS sequences of Hemileia vastatrix from the coffee producing areas of Quillabamba and Villa Rica, sampled in 2014 and 2018, and from haplotypes from Brazil, Colombia and CIFC reported in the NCBI. Circles represent a unique haplotype; the size of circles is proportional to the number of sequences for that haplotype; transverse lines represent a simple mutation while black nodes symbolize lost or non-sampled haplotypes. rDNA-ITS, internal transcribed spacers of the nuclear ribosomal DNA.
The mismatch distribution reinforces the model of an expansive growth of the H. vastatrix population during stages of high incidence of the disease. Moreover, it showed an exact fit under the growth-decrease model (Fig. 2) due to the presence of a high number of fungus variants with low frequency, suggesting that there was a sudden population expansion from processes from a bottleneck and/or selective sweep. This result is related to negative values of the neutrality tests, which indicate a significant deviation from the Wright-Fisher neutrality.
Population structure
The AMOVA revealed that the H. vastatrix population is not structured neither by geographic origin nor by sampling years. Table 4 shows a non-significant level of genetic structure among H. vastatrix populations from Quillabamba and Villa Rica (FCT = ‒0.00124, P = 1.0 ± 0.0). Similarly, the estimated variation among fungi collected in 2014 and 2018 inside each coffee producing areas was low and non-significant (0.30%, P = 0.17526 ± 0.00264). Most of the variation was accounted by the variations inside years, regardless of coffee production areas (99.82%; P = 0.20053 ± 0.00271). Likewise, Table 5 shows the absence of a population structure among sampling years (FCT = 0.00059, P = 0.33119 ± 0.00298) with most of the variation explained by the variations inside coffee producing areas regardless of the year (99.76%, P = 0.19693 ± 0.00316). Furthermore, the Mantel Test was non-significant (r = 0.002470158; P = 0.2031), indicating a lack of genetic isolation by geographic distance. Results of AMOVA analysis and the Mantel Test suggest that the H. vastatrix populations are not structured, showing a large and undifferentiated population. These results are congruent with previous studies based on rDNA-ITS sequences and RADseq in H. vastatrix populations originating from farms of Brazil and from a world collection (Santana et al., 2018; Silva et al., 2018, respectively).
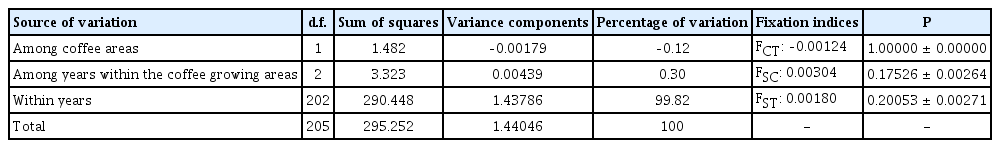
Analysis of molecular variance (AMOVA) of Hemileia vastatrix population structured based on the geographic origin

Analysis of molecular variance (AMOVA) of Hemileia vastatrix grouped based on sampled years
The non-structuring of the H. vastatrix populations in terms of geographic origin could be explained by a high gene flow, resulting from the movement of infected plant material (Quispe-Apaza et al., 2017). In addition, Villa Rica is considered as a coffee seed supplying area to many other producing zones in Peru, therefore favoring the spread through the movement of people, seed and/or infected plants. On the other hand, the wind also plays an important role in pathogen dispersal to long distances and was suggested as the main cause for coffee leaf rust arrival in South America (Bowden et al., 1971) and for its rapid spread throughout Brazil (Schieber and Zentmyer, 1984). Extinction and recolonization processes for biotrophic pathogens might also explain the observed low genetic differentiation. This phenomenon is characterized by decline cycles in the population to reach what is called the source population, “the founder effect”, this is then followed by a process of rapid growth, where mutation events tend to differentiate populations and the gene flow to decrease. Therefore, the lack of structuring of H. vastatrix population could be due to the existence of different mechanism of gene flow for the pathogen, whose population could be considered as a metapopulation, according to models proposed by Slatkin (1977).
Intraspecific phylogenetic relationship
Analysis of 303 DNA sequences of H. vastatrix, from two coffee producing areas in Peru and those reported by the NCBI (Table 2) resulted in the identification of 174 haplotypes, 153 of which were unique. The haplotype network (Fig. 3) showed three mains nodes, corresponding to the haplotypes Hap_1, Hap_10 and Hap_13, of which the Hap_1 and Hap_13 were distributed in the three coffee producing countries (Brazil, Colombia, Peru). Hap_10 was only found in Colombia and Peru.
The haplotype Hap_1 contains sequences of the race II (B1_1_raceII-CIFC; B1_2_raceII-CIFC; B2_1_raceII_Vicosa; B3_3_raceII_CIFC), 10 Brazilians sequences, two Colombian sequences, 19 Peruvians sequences from the year 2014 and 19 Peruvians sequences from the year 2018. Furthermore, the haplotype Hap_10 includes sequences of the race XXII (EF394119.1_RaceXXII-637; EF394122.1_raceXXII-535), one sequence reported as the race II (B3_4_raceII_CIFC), two Colombian sequences, 20 Peruvian sequences from year 2014 and 15 Peruvian sequences from the year 2018. The haplotype network revealed that the haplotype Hap_13 contains sequences of the race I (B4_1_raceI_Caratinga; B4_2_raceI_Caratinga), six Brazilian sequences, four Colombian sequences, and four Peruvians sequences from the year 2014. These haplotypes, Hap_1, Hap_10, and Hap_13, more frequent and distributed in both coffee growing areas, could be considered as ancestral haplotypes according to the coalescent theory (Slatkin and Hudson, 1991). Similarly, the Fig. 3 shows a star-like haplotype tree with abundant unique haplotypes, this is because new alleles arise as the population recovers from loss of diversity. Among the three ancestral haplotypes evident in all populations and distributed in both coffee growing areas, corresponding to races I (V2,5), II (V5), and XXII (V5,6) reported in the GenBank by Cristancho et al. (2007) and Santana et al. (2018), haplotypes Hap_1 and Hap_10 were maintained in time and space. Haplotype Hap_1, corresponding to race II, was reported for the first time in Peru in 1979 while haplotype Hap_10 (race XXII) may have evolved in the country from Hap_1 (founder population) or it may have entered from Colombia, adapting to the agroecological conditions of the coffee growing areas in Peru (Fig. 3).
Distribution and prevalence of the H. vastatrix races seem to be completely dependent on the genotypes grown locally (Bettencourt, 1981). In India, with the oldest world’s coffee rust resistance breeding program, 39 races of the fungus have been identified (Bhat et al., 2013) with a broad virulence spectrum. (Kosaraju et al., 2017). Similarly, 15 races were initially described only for Brazil: I, II, III, VII, X, XIII, XV, XVI, XVII, XXI, XXII, XXIII, XXIV, XXV, XXXI, and XXXVII (Cabral et al., 2009). Subsequently, Silva (2017) reported 15 additional races in Brazil. In Kenya, 12 physiological races were reported (I, II, VII, XV, XX, XXIV, III, XVII, XXIII, XXXVI, XLI, and XLII) (Gichuru et al., 2012), two of which being the most common (races I and II). In Venezuela, only races I and II were reported (Silva Acuña et al., 1997), while, in Colombia, races II, XXII, XXV, XXIII, XVII, and XXX were reported, although Cristancho et al. (2007) estimated that there were more than ten unidentified rust races attacking coffee plants derived from the HDT. The emergence of these new races with a wide virulence spectrum is the result of the high genetic diversity of the pathogen and the great evolutionary potential of the resistance trait (Cabral et al., 2009).
In Peru, the main prevalence of two fungus variants could be the result of the uniformity of commercial varieties, which are cultivated in different coffee growing areas in the country, along with a limited introduction of resistant coffee varieties. Until 2014, the coffee production in Quillabamba and Villa Rica was mainly based on susceptible C. arabica cultivars, mainly the Caturra and Typica varieties, while only 10.6% and 11.4% of the coffee plants, respectively, were resistant to the disease. This situation changed over the time and, in 2017, resistant coffee plants represented the 57.8% and 78.9%, respectively (SENASA, unpublished data) of the total. Coffee genotypes derived from Timor Hybrid (HDT), used in coffee plant breeding, have resistance genes (SH6, SH7, SH8, and SH9) introgressed from C. canephora (Bettencourt and Rodrigues, 1988; Rodrigues et al., 1975) and this is considered the principal factor leading to the emergence of new rust races. Hence, the appearance of new H. vastatrix races capable of overcoming the resistance of new coffee cultivars in the field is likely. Studies carried out in other rusts showed a correlation between virulence phenotypes and the genetic differentiation assessed by simple sequence repeat markers (Kolmer and Ordoñez, 2007); likewise, Aggarwal et al. (2018) highlighted the importance of rDNA-ITS markers to differentiate Indian pathotypes from Puccinia striiformis f. sp. tritici. Santana et al. (2018) also highlighted rDNA-ITS use to explain the population structure of H. vastatrix from Brazil. In this context, neutral markers could better reveal the genetic relationship between isolates, since the genetic variation of the virulent phenotype represents a small part of the genetic variation (Liu et al., 2018).
The internal transcribed spacer of the rDNA has been proposed by Schoch et al. (2012) as a main barcode marker for fungi to the Consortium for the Barcode of Life, in addition, the use of the rDNA-ITS as an effective marker has been highlighted for differentiating not only at the species level but also among individuals in a population (Bradshaw et al., 2020; Estensmo et al., 2021; Nilsson et al., 2008; Wu et al., 2018). However, its use has been questioned because different levels of intragenomic variation have been reported in a wide range of taxa. Lindner et al. (2013) studied the intragenomic variation of the ITS1 region of 99 axenic single-spore cultures of fungi (phylogenetically diverse) using the 454-pyrosequencing technique and reported that intragenomic variation of the ITS1 region is relatively rare in fungi (it is present only in 3-5% of species investigated in their study). In addition, they reported that the lack of homogenization of ITS paralogs by concerted evolution produces complex phylogenetic trees and high level of variation (average nucleotide difference), which has not been observed in our study. However, we cannot completely rule out the existence of intragenomic variation in H. vastatrix.
Analysis of the rDNA-ITS sequences of H. vastatrix from two coffee growing areas sampled in 2014 and 2018 allowed determining that the low nucleotide diversity and the high haplotype diversity, found in the pathogen through the space and time, are due to the cycles of decline and increase in population size experienced by H. vastatrix throughout its history. Moreover, we propose that each outbreak of the disease in the two coffee growing areas started from a few genotypes, which, according to the intraspecific phylogenetic analysis, could correspond to the races II and XXII of this pathogen. The prevalence of these two variants is still the result of the persistence of susceptible varieties in the coffee fields. Furthermore, evolutionary changes were not observed in the pathogen in response to the interaction with the new resistance genes of its host. Finally, the lack of population structure may be due to the different mechanism of genes flow used by H. vastatrix. Hence, according to the Slatkin’s model (1977) we suggest that the H. vastatrix population could be a metapopulation.
Notes
Conflicts of Interest
No potential conflict of interest relevant to this article was reported.
Acknowledgements
This research was supported by project N° 177-2015 FONDECYT (The National Fund for Scientific and Technological Development) and Universidad Nacional Agraria La Molina, Peru.