


Rice is one of the oldest domesticated, monocotyledonous annual grasses, which feeds more than 3 billion of worldŌĆÖs population and accounts for 50% to 80% of daily calorie uptake (Tiruneh et al., 2019). Rice sheath blight, caused by fungal pathogen Rhizoctonia solani Kuhn (Thanatephorus cucumeris (Frank.) is very destructive disease that causes severe economic losses (Marshall and Rush, 1980). The pathogen is a soil-borne necrotroph which survives either as sclerotia or mycelia in the debris of host plants.
The use of high-yielding semi-dwarf rice cultivars, excessive application of nitrogen fertilizer and high planting density resulted in quick spread of the disease in a short period of time. The yield loss in rice due to sheath blight disease is estimated to 10-30% and goes up to 50% under favorable conditions (Richa et al., 2016). Though cultural, biological, and chemical controls are available, they are not feasible methods for ShB management because of the wide host range of the pathogen and its aggressiveness. The only effective way is to develop resistant cultivars through molecular breeding approaches.
Breeding for ShB resistance has been difficult, mainly because of the lack of identified resistant donors in cultivated varieties (Bonman et al., 1992). Identifying resistant germplasm is essential in developing resistant cultivars (Jia et al., 2011).
Resistance to rice ShB is a complex, quantitative trait controlled by polygenes (Li et al., 1995; Pinson et al., 2005; Sha and Zhu, 1989). However, few researchers proposed that ShB resistance in some rice varieties is controlled by only a few major genes (Pan et al., 1999; Xie et al., 1992). The advent of molecular markers has made it feasible to map and characterize the polygenes underlying quantitative traits in natural populations (Tanksley, 1993). Several quantitative trait loci (QTL) for ShB resistance have been identified using mapping populations derived from indica or japonica rice. Many QTLs have been mapped in different rice cultivars showing partial resistance, including Tetep, Teqing, jasmine, and many other germplasm lines (Bal et al., 2020; Channamallikarjuna et al., 2010; Che et al., 2003; Li et al., 1995; Liu et al., 2009; Pinson et al., 2005; Yadav et al., 2015; Zou et al., 2000). Segregating populations derived from the crosses between contrasting parents have been used to map QTLs associated with ShB resistance and its associated traits. The identified major and minor QTLs were physically mapped on different rice chromosomes, and putative candidate genes were predicted.
Bulk segregant analysis (BSA) is a rapid method for identifying DNA markers linked to a gene of interest in a population with the reduced number of plants to be genotyped (Michelmore et al., 1991). BSA has been successfully used in rice for identifying markers linked to QTLs associated with grain quality parameters, blast resistance, heat tolerance, drought tolerance, gall midge resistance, and sheath blight resistance. Rice genotypes with significant level of resistance to R. solani are identified, however sources with complete resistance for sheath blight has not been identified which makes the breeding program difficult (Groth and Novick, 1992). In this regard, search for resistant germplasm has become an international effort towards resistance breeding (Jia et al., 2007; Molla et al., 2020; Prasad and Eizenga, 2008).
Landraces are the natural reservoirs of valuable traits created by diverse allelic combination occurred over several generations. Exploitation of such diversity in rice appears promising alternative to search for resistance source against ShB. In the current study, 101 rice landraces collected from Western Ghat and hilly regions of Karnataka, India were screened for ShB resistance and among them, landrace Jigguvaratiga showed consistent moderate resistance over three seasons of evaluations. The present study aimed to exploit the newly identified resistance source and to identify the DNA markers associated with ShB resistance in the Jigguvaratiga mapping population.
Materials and Methods
Evaluation of rice landraces for identifying the resistance sources against R. solani
A set of 101 rice accessions screened against R. solani AG1IA group at the Institute of Agri Biotechnology, University of Agricultural Sciences, Dharwad, India. Each germplasm line was sown in earthen pot with 5 plants per pot in three replications. Each pot was filled with sterilized soil with recommended dose of fertilizers. Tetep and BPT5204 variety were used as resistant and susceptible checks respectively. Pathogen R. solani was isolated from ShB infected rice plant collected from Rice Research Station, Mugad, Dharwad (15_300N; 75_040E) by following standard tissue isolation procedure on potato dextrose agar and pure culture was obtained. Pathogen was multiplied on typha grass (Typha angustata) stem bits as explained by Bhaktavatsalam et al. (1978). After 45 days of sowing, the plants were inoculated with the pathogen by placing 3 colonized typha bits between the tillers at the center of rice hill. After inoculation, the plants were covered with transparent polythene cover to maintain high humidity for maximum disease development.
Disease response of each germplasm along with parents was measured using the ratio between the height of the pathogen growing up in the plant and the height of the leaf collar on the last emerged leaf. Measurements on the day at which the ratio reached 100% for susceptible check BPT5204, were considered for further analysis.
Disease score (0-9) was given on the basis of relative lesion height (RLH) according to standard evaluation system given by IRRI (International Rice Research Institute, Philippines) (Standard Evaluation System 2002). RLH was calculated with the formula: RLH = height of lesion on sheath of plant (cm)/height of the plant (cm). Further, RLH was converted to percentage and the lines were classified according to the RLH% as follows: 0, immune; 1-20%, resistant (grade 1); 21-30%, moderately resistant (grade 3); 31-45%, moderately susceptible (grade 5); 46-65%, susceptible (grade 7) and >65%, highly susceptible (grade 9).
Development of mapping population
Crosses were made between resistant donor Jigguvaratiga and susceptible variety BPT5204 to develop F1s. Hybridity was confirmed using polymorphic markers and true F1s were selfed to generate F2 population.
Screening of F2 population for sheath blight resistance under artificial epiphytotic condition
Total 160 F2 plants were screened against R. solani under artificial epiphytotics in controlled glasshouse condition at the Institute of Agri Biotechnology, University of Agricultural Sciences, Dharwad, India. Each F2 plant was sown in earthen pot filled with sterilized soil and recommended fertilizer dose was applied. The details of inoculation methods and disease scoring are similar as explained above.
Observations on agronomic traits
The morphological observations of F2 population along with their parents were recorded for plant height, days to 50% flowering, number of tillers per plant, panicle length and flag leaf length.
Parental polymorphism and genotyping of F2 population
Total 240 simple-sequence repeat (SSR) markers spanning all the 12 chromosomes in rice (http://www.gramene.org/)were used to identify the polymorphic markers between resistant donor Jigguvaratiga and susceptible BPT5204. Among 240 SSR markers, 56 markers showed parental polymorphism and the details of polymorphic markers are given in Supplementary Table 1. Genomic DNA was extracted from the leaf tissues of 30 days old seedlings by following the cetyltrimethylammonium bromide (CTAB) method (Murray and Thompson, 1980). Primer sequences for SSR markers were obtained from Gramene SSR marker Resource (http://www.gramene.org). The primers were custom synthesized by Sigma-Aldrich Chemicals Pvt. Ltd. (Bangalore, India). Polymerase chain reaction (PCR) amplifications were carried out using thermal cycler (Master cycler gradient 5331-Eppendorf version 2.30.31-09, Malente, Germany) and Touch-down PCR profile was used for amplification. PCR products were subjected to electrophoresis on 4.0% Metaphor agarose gel and visualized in a gel documentation system (Syngene Pvt. Ltd., Frederick, MD, USA).
Bulk segregant analysis
BSA provides a rapid method for identifying markers linked to a gene of interest in a population (Michelmore et al., 1991). In BSA method, two bulks having distinct and contrasting phenotypes for the sheath blight resistant versus susceptible generated from a segregating population of Jigguvaratiga and BPT5204 was used. Based on ShB reaction data, two bulks were prepared by pooling aliquots containing DNA approximately 50 ng/╬╝l from ten each resistant and susceptible F2 plant. Polymorphic markers were used to screen the bulks along with the parents. DNA samples were used to validate the relationship between resistance/susceptibility and marker loci of corresponding individuals of the bulks.
Statistical analysis
Variability parameters were performed in F2 segregating population viz., mean, range, skewness, kurtosis, standard deviation, and simple correlation coefficients were worked out. The frequency distribution of F2 plants for the ShB disease and other traits was analyzed using SPSS version 16.0 (SPSS Inc., Chicago, IL, USA). Statistical analysis of data was done using MS-EXCEL and other software. Simple correlation was computed by using the following formula, r = Cov (x, y)/ŌłÜVx ├Ś Vy.
Where, Cov (x, y) = Covariance between the characters x and y.
Vx = Variance of the character x and Vy = Variance of the character y.
Chi-square test
Chi-square test was carried out on the data obtained from the segregating generation (F2) for resistant versus susceptible to determine the goodness-of-fit to expected ratios of simple Mendelian inheritance. Where, O = Observed frequency in any class, E = Expected frequency in same class, Ōłæ = Summation of over all classes.
The degree of freedom (df) in Žć2 test is (n ŌłÆ 1). Where n is the number of classes.
Analysis for marker-trait association and single marker analysis
Single marker analysis (SMA) was performed to determine the significant contribution of the markers towards ShB resistance by one-way ANOVA using MS-Excel. The coefficient of determination (R2) which explains the percent of phenotypic variance explained by the markers was calculated.
Co-segregation analysis
Each line was tested for co-segregation between allele at a marker locus and disease reaction. Line showing resistance allele at linked marker locus and disease resistance (score less than 3.0) was considered positive for co-segregation. Frequency of lines showing co-segregation was compared with that of lines not showing co-segregation using z test (standard normal deviate test for proportion) (Rao, 2007), where the z value was compared with the critical value of 1.96 and 2.58 at 5% and 1% level of significance, respectively (irrespective degrees of freedom). High proportion of lines showing co-segregation and a significant z value was considered as a good case of marker validation.
Those significant and major marker-trait associations showing >10% R2 were analyzed for their position in the genome and functional annotation using the gene prediction data. The marker sequence was retrieved from http://www.gramene.org and analyzed to find the location of the marker by BLAST search. DNA sequence was given as query to find the protein in http://www.ncbi.nlm.nih.gov.
Results
Germplasm evaluation and identification of resistance sources for sheath blight
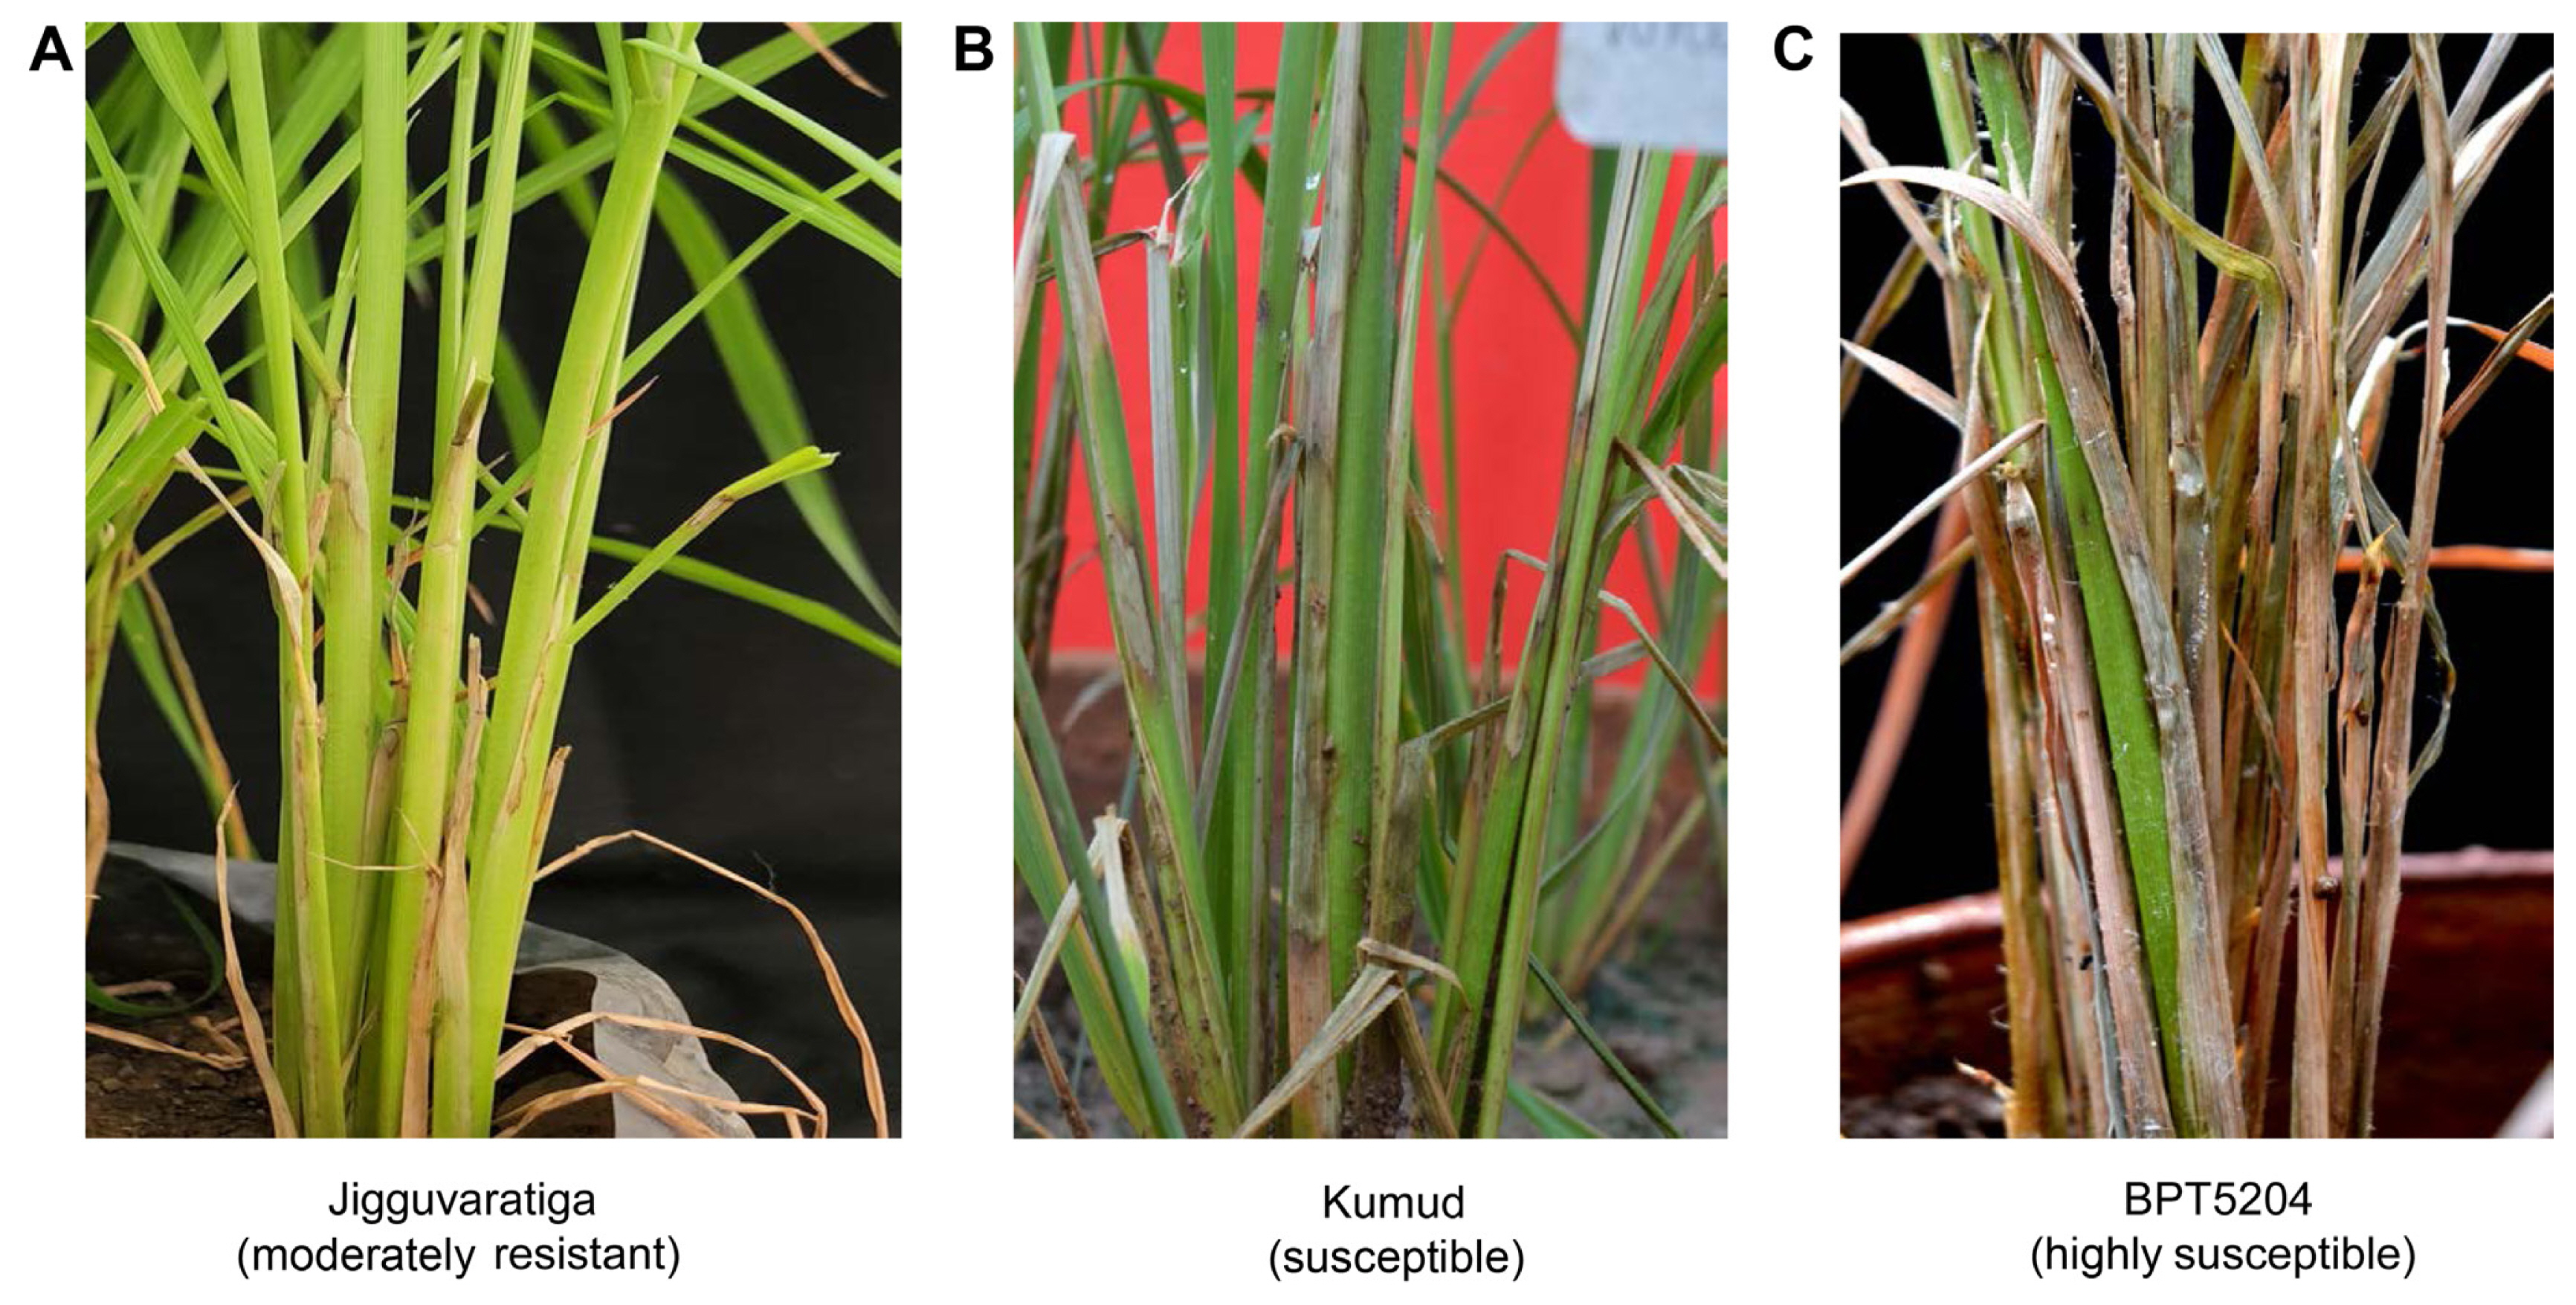
Total 101 rice landraces collected from Karnataka state were screened under artificial epiphytotic situation for sheath blight resistance. Tetep and BPT5204 variety were used as resistant and susceptible check, respectively. Based on the RLH percentage, the landraces were classified into five classes viz. Resistant (RLH 0-20%), moderately resistant (RLH 21-30%), moderately susceptible (RLH 31-45%), susceptible (RLH 46-65%), and highly susceptible (RLH 66-100%) (Table 1, Fig. 1). RLH ranged from 21 to 100% among the tested entries. The susceptible check BPT5204 showed 80% (Disease score 9) and the resistant check Tetep showed 28% of RLH (Disease score 4). In this study, 33 landraces were moderately susceptible, 21 were susceptible and 39 were highly susceptible. Six landraces, Jigguvaratiga (RLH 21%), Honasu (RLH 22%), Jeer Sali (RLH 22%), Jeeraga-2 (RLH 23%), Bili Kagga (RLH 29%), and Medini Sanna Batta (RLH 30%) were moderately resistant and rest of germplasm grouped either in moderately susceptible, susceptible or highly susceptible category (Supplementary Table 2).
The landraces with susceptible reaction failed to reach reproductive stage and formation of sclerotial bodies was recorded on highly susceptible lines.
Development of mapping population for ShB resistance
Landrace Jigguvaratiga consistently exhibited moderate resistance for three wet seasons 2017-2019 against R. solani and RLH ranged from 20-21%. F1s were developed by crossing Jigguvaratiga with BPT5204. The F1s were challenge inoculated and found to be moderately resistant for ShB disease (RLH 23%). Hybridity was confirmed using few polymorphic markers RM337, RM251, and RM279 (Supplementary Table 1). True F1s were selfed and F2 seeds were generated.
Phenotyping of F2 population for ShB resistance
The collected F2 seeds were sown and screened against R.solani. Disease observation was taken as RLH on 15th day of inoculation. The RLH for F2 individuals ranged from 23.5% to 87%. The mean value recorded for RLH was 40.63%. The results revealed that variability for the morphological traits viz., plant height, number of tillers per plant, days to 50% flowering, number of panicles per plant, panicle length, and flag leaf length which ranged from 40-92 cm, 1-5, 98-117, 1-5, 5.5-19.6 cm, and 9.5 to 33.7 cm, respectively (Table 2).
The frequency distribution of F2 plants for the ShB disease and other traits was calculated. If the skewness and kurtosis value of genotypes ranged from ŌłÆ2 to +2 and ŌłÆ3 to +3 respectively, then the genotypes are said to be normally distributed. Skewness and kurtosis for disease reaction and other traits ranged from ŌłÆ1 to +1 and ŌłÆ2 to ŌłÆ1, respectively, indicating the quantitative nature of the traits (Table 2, Supplementary Fig. 1).
Correlation study in F2 population for RLH and other traits
RLH was negatively correlated with other traits. Significant negative correlation was observed between RLH and plant height (-0.361), number of tillers per plant (-0.355), number of panicle per plant (-0.495), and flag leaf length (-0.402). Usually but not always, increased plant height is associated with decreased RLH (Table 3).
Significant positive correlation was observed between plant height and the number of tillers per plant (0.419), the number of panicles per plant (0.525) and flag leaf length (0.740), however signicant negative correlation was recorded with days to 50 % flowering (-0.427). Flag leaf length showed significant positive correlation with the number of panicles per plant (0.493) and panicle length (0.641) (Table 3).
Bulked segregant analysis and marker-trait association using SMA
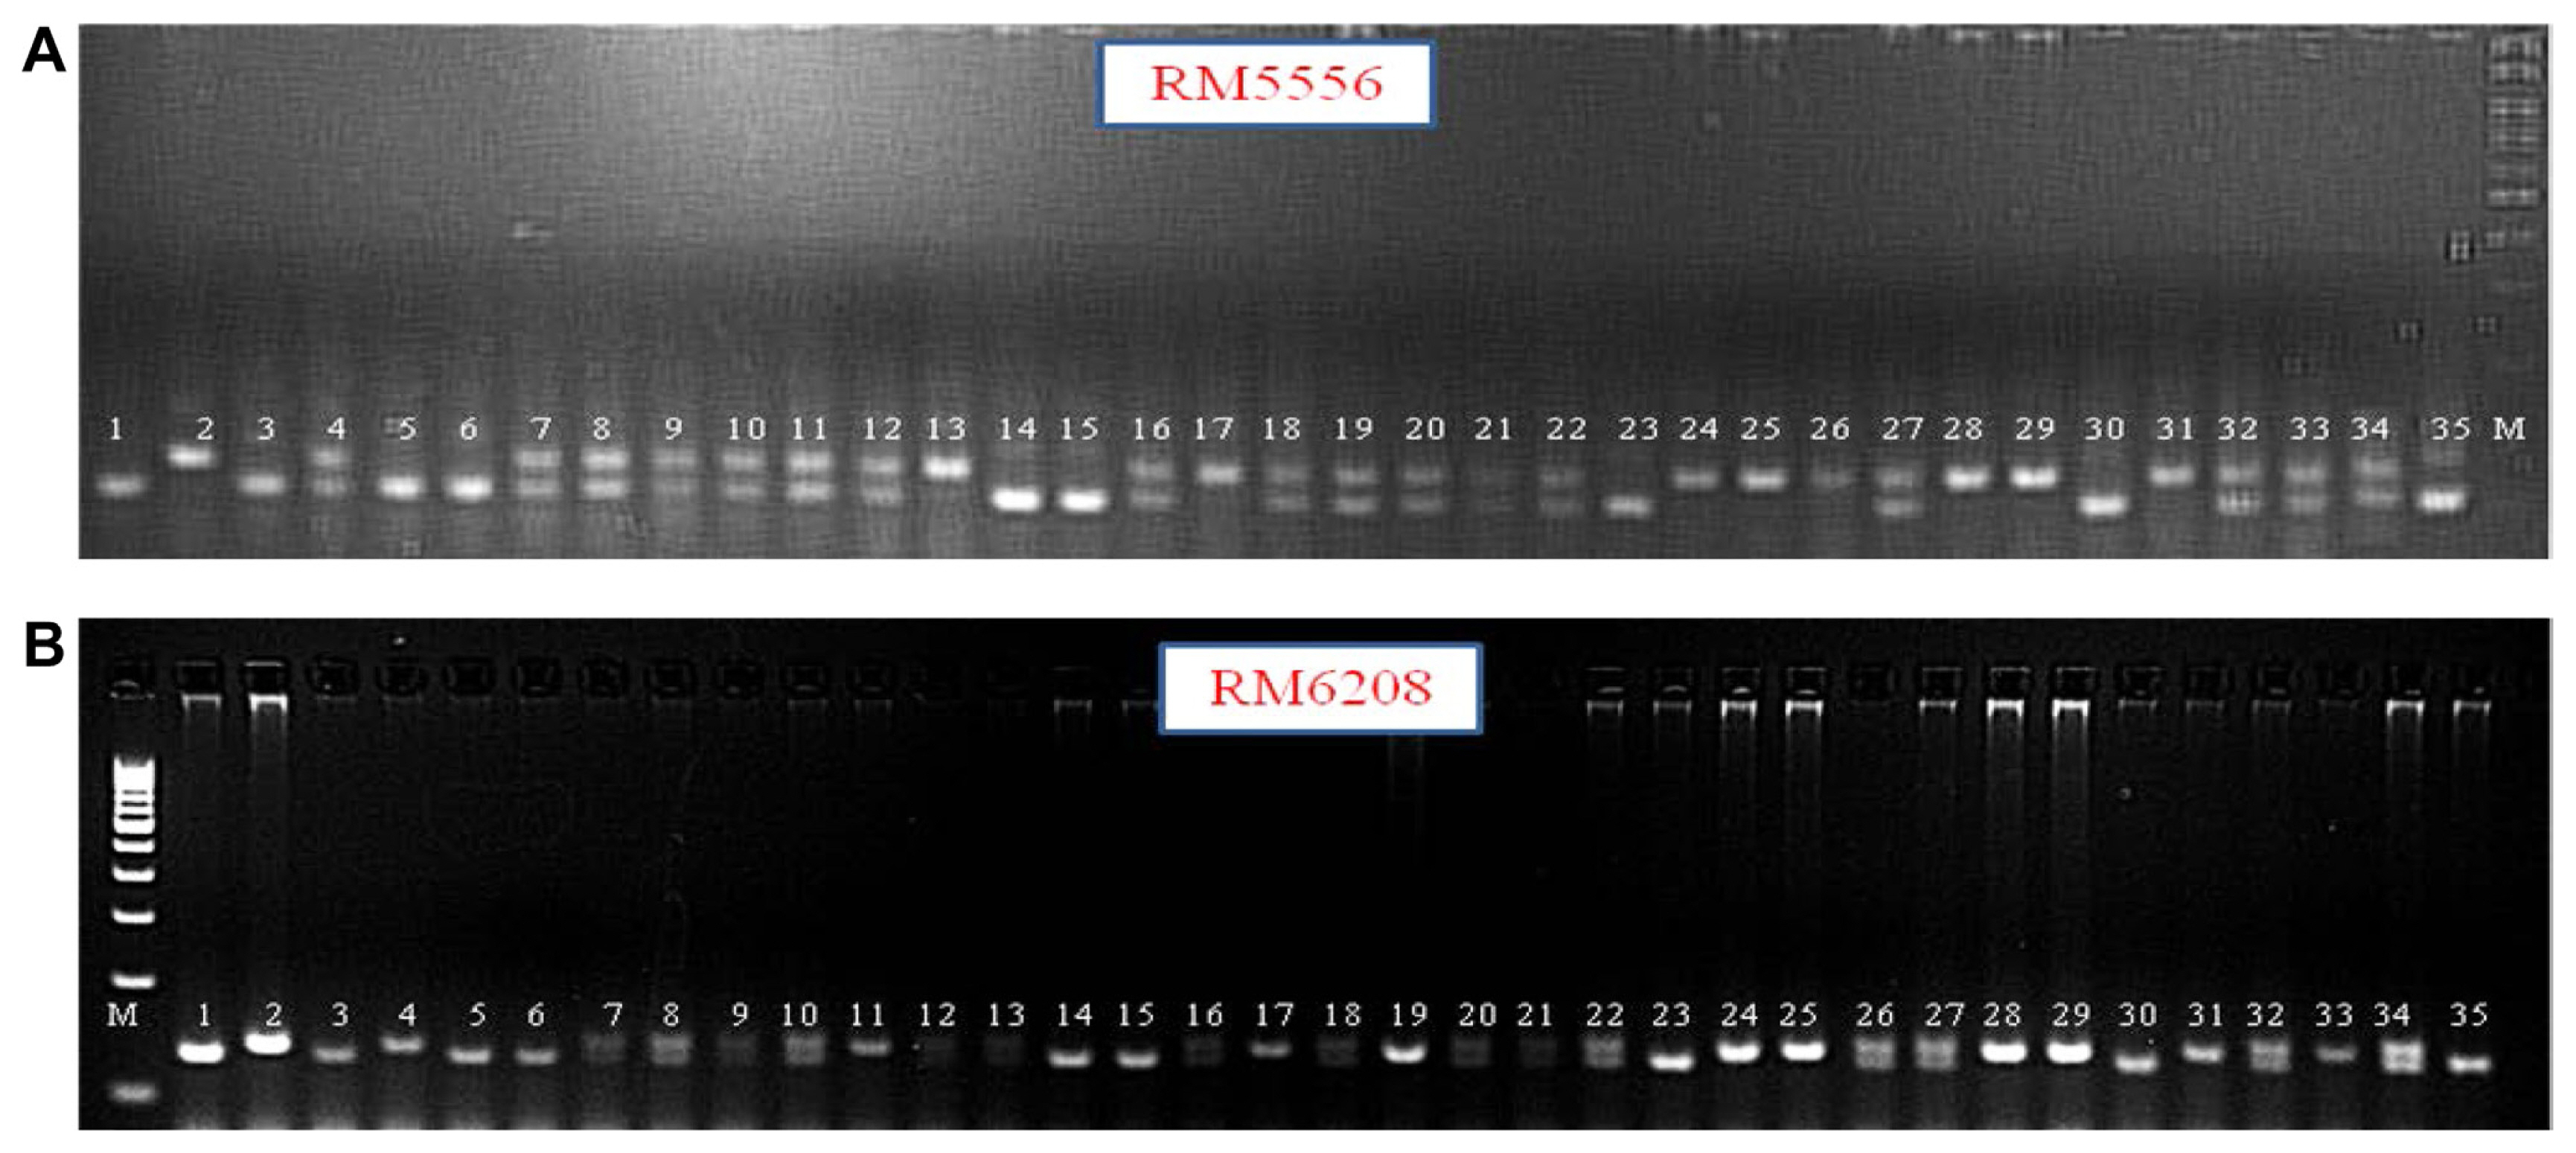
Using the BSA method, two bulks having distinct and contrasting phenotypes for the trait of interest were generated from a segregating population from a cross Jigguvaratiga and BPT5204. Genomic DNA was isolated from the parents and F2 individuals using CTAB method. Based on the ShB reaction data, resistant and susceptible DNA bulks were prepared. Total of 240 SSR markers spanning 12 chromosomes of rice were checked for parental polymorphism. The two tail bulks were genotyped with 56 polymorphic markers along with the parents, amongst 35 are already reported to be linked to ShB QTLs and rest are not yet reported for ShB resistance. Markers RM5556, RM6208, and RM7 clearly distinguished resistant and susceptible bulks, indicating their possible co-segregation with the ShB resistance. RM6208 and RM7 markers are newly identified for ShB resistance in the present study (Fig. 2).
Further, genotyping of F2 individuals was done using RM5556, RM6208, and RM7 markers. Chi-square analysis was done, which indicated the goodness-of-fit (1:2:1) only for RM5556 and RM6208 (Table 4, Fig. 3A and B). Hence, RM7 was rejected from further analysis. These results indicated the possible presence of genetic loci for sheath blight resistance on chromosome 8 based on map location of RM5556 and RM6208.
Marker-trait association using SMA and co-segregation analysis
To analyze the marker-trait association, co-segregation test and SMA was performed using genotypic data obtained from RM5556 and RM6208. SMA indicated the significant association of trait with both the marker with a phenotypic variance of 28.29% and 20.06% at probability of 0.00 and 0.03, respectively. Co-segregation of markers based on z test revealed significant association of markers RM5556 and RM6208 for ShB resistance with z value 7.67 and 4.38, respectively (Tables 5 and 6).
The genomic locations of the associated markers (RM5556 and RM6208) were searched in silico. The clone sequences of the RM5556 and RM6208 markers were retrieved from Gramene and BLASTX search tool was used to find the probable proteins coded by these sequences (Supplementary Fig. 2). The results revealed that RM5556 loci coded for unknown protein and RM6208 loci coded for stearoyl ACP desaturase proteins (SADs). This protein is involved in defense mechanism against pathogen. The suppression of SADs proteins is known to regulate defense response via fatty acid signaling pathway (Kachroo and Kachroo, 2009).
Discussion
Rice sheath blight (ShB) caused by R. solani pathogen is a destructive disease worldwide causing significant yield loss (Lee and Rush, 1983). R. solani is a soil-inhabiting facultative pathogen with broad host range. The disease is believed to be controlled by multiple genes or QTLs (Pinson et al., 2005). Breeding for sheath blight resistance is very difficult in absence of lack of reliable stable resistance sources in rice germplasm. No complete resistance has been identified in rice varieties or wild-related species (Srinivasachary et al., 2011). To date, limited resources of genetic resistance are available worldwide and hence searching for resistant germplasm has become an international effort (Prasad and Eizenga, 2008). However, presence of sources with varied degree of resistance has been reported and different QTL governing ShB resistance are identified (Jia et al., 2012). Rice germplasm Tadukan, Tetep, Teqing, and Jasmine85 are reported to exhibit high level of quantitative resistance (Channamallikarjuna et al., 2010; Jia et al., 2009; Zuo et al., 2010) and many QTLs were mapped using them. Tetep is a well-documented source of ShB resistance and several QTLs have already been mapped using it (Channamallikarjuna et al., 2010). Moderate level of resistance in Tetep for shB (grade 3: RLH 21-30%) was earlier reported by Yadav et al. (2015) and our study also showed moderate resistance (RLH 28%). In present study, we screened 101 rice germplasm including landraces and improved lines. The landrace Jigguvaratiga which consistently showed moderate resistance for three consecutive seasons was identified. Jigguvaratiga with better level of resistance (21%RLH) than Tetep can be an additional resistance source against ShB in future breeding program. Different resistant germplasm lines contain different QTLs. For example, using the same susceptible parent Lemont, the QTLs identified in Teqing (Li et al., 1995; Pinson et al., 2005) are different from those identified in Jasmine 85 (Liu et al., 2009; Zou et al., 2000). Several QTLs conferring resistance to ShB were reported using various markers particularly SSR markers (Bal et al., 2020; Eizenga et al., 2013; Jia et al., 2012; Yadav et al., 2015). In the present investigation, segregating population (F2) was screened for ShB resistance and it exhibited significant variation for the disease reaction. Frequency distribution of F2 for ShB disease reaction and agronomical traits were continuous and fitted into normal distribution as expected from a quantitative trait (Yadav et al., 2015).
Plant height in rice is a complex trait controlled by QTLs (Zuo et al., 2010). The correlation between morphological traits and ShB resistance has been frequently observed in many findings (Channamallikarjuna et al., 2010; Groth and Novick, 1992; Li et al., 1995). Plant height and heading date are the two major morphological traits found to be correlated with ShB resistance in many of the QTL studies (Molla et al., 2020). In our study also, disease is negatively correlated with plant height. Yadav et al. (2015) reported a comparable results and showed continuous segregation of plant height and other agronomical traits in the F2 population. Tall cultivars increase the resistance against the ShB disease. QTLs for sheath blight resistance have been often detected in the same region as QTLs for heading date and for plant height (Li et al., 1995; Pinson et al., 2005; Sharma et al., 2009; Zou et al., 2000). Many reports suggest that proper disease development, expression, and disease severity can be related with plant because relatively tall-statured plants favor disease escape delaying the spread of pathogen to canopy height (Sharma et al., 2009). Such results are possible, since ShB disease rating system is mainly based on lesion height in relation to plant height there is a possibility of correlation of resistance with increase in plant height. Nearly 34.5% of ShB-QTL reported to date co-localize with QTLs for morphological traits and heading date. Such a co-localization of QTL could be due to a pleiotropic effect or tight linkage (Li et al., 1995).
To open up a new platform for creation and development of new germplasm with ShB resistance, development of mapping population and DNA marker identification should be the first step. Bulked sergeant analysis is an efficient strategy for identifying the DNA markers linked to the gene of interest (Michelmore et al., 1991). In bulked DNA, all loci are randomized; except for the region containing the gene of interest and polymorphic markers may represent markers that are linked to the gene or QTL of interest (Collard and Mackill, 2005).
In our study, F2 population (Jigguvaratiga ├Ś BPT5204) was phenotyped against R. solani using typha bit method of inoculation and DNA from plants showing extreme reaction was bulked. Resistant and susceptible bulks along with parents were screened using polymorphic markers. Markers RM5556, RM6208, and RM7 showed polymorphism between resistant and susceptible bulk corresponding to resistant and susceptible parents. The goodness-of-fit chi-square test showed, markers RM5556 and RM6208 followed the Mendelian segregation pattern of 1:2:1 whereas, RM7 showed segregation distortion and hence RM 7 was rejected in further association analysis.
Markers RM5556 and RM6208 showed significant association with ShB resistance in SMA, performed by using F2 genotypic data. Ideal marker is one that co-segregates with the gene/trait of interest (Collard and Mackill, 2005). In the current study, the Z test confirmed the co-segregation of these two markers with ShB resistance with significant Z values. RM5556 marker located on chromosome 8 positioned at 36.00 cM for ShB resistance was first reported by Lavale et al. (2018) with the phenotypic variance of 16.04% in Tetep. The phenotypic variance by this marker in present study was 28.29%. RM5556 marker is already reported to ShB resistance through association mapping and present study validates its association with ShB resistance. A QTL is considered to be consistent and stable if it is been mapped and reported in at least two independent studies, from the same or from a different genetic background.
Other marker RM6208 located on chromosome 8 positioned at 42.90 cM was found associated with ShB resistance in our study. This marker explains 20.06% phenotypic variance. This is the first report of RM6208 marker association for sheath blight resistance in rice. So there is a scope to fine map the QTL region on chromosome 8 between RM 5556 and RM6208 conferring ShB resistance with more number of markers in that region. In silico analysis revealed that RM5556 loci resides a protein, the function of which yet to be identified. RM6208 loci resides the SADs, which is involved in defense mechanism against plant pathogens. Result obtained during in silico analysis of qShb 9.2 QTL predicted 32 genes and functional annotation identified one defense responsive gene, coded for ╬▓,1-3-glucanase like protein in a single copy (Yadav et al., 2015). Similarly, functional annotation of qSBR11-1 QTL for sheath blight resistance predicted 154 genes including 11 tandem repeats of chitinase gene that may be responsible for resistance (Channamallikarjuna et al., 2010). Nine defense genes and LRR encoding genes present in the stable QTL region qShB.1.1 flanked by the markers RM11935 and RM11968 on chromosome1 were reported to be responsible for ShB resistance in moderately resistant rice cultivar CR1024 (Samal et al., 2022). Decrease in SADs protein results in regulation of defense response via fatty acid signaling pathway (Kachroo and Kachroo, 2009). Suppression of other fatty acid desaturase genes in rice like OsSSI2 was shown to enhance resistance to blast and leaf blight diseases in rice (Jiang et al., 2009). Decreased SADs increases the salicylic acid mediated defense pathway, resulting constitutive expression of PR genes, activation of the hypersensitive response and enhancement of broad-spectrum resistance in rice (Rohilla et al., 2002). The function of the SADs in the plant defense was also proved in wheat where overexpression of the SAD genes showed to compromise the resistance to powdery mildew (Song et al., 2013).
In conclusion, the current study reports the association of RM5556 and RM6208 markers for ShB resistance and this is the first report on association of RM6208 with ShB resistance. The marker-trait association is considered to be stable, if the same marker is reported in different genetic backgrounds for the trait of interest. We have reported significant association of RM5556 for ShB in Tetep through association mapping in our previous experiment (Lavale et al., 2018) and the present study confirms this association through biparental analysis in genetic background of landrace Jigguvaratiga. The putative candidate genes or QTLs harboring at the marker interval of RM5556 and RM6208 on chromosome 8 need to be fine-mapped and can further used to develop ShB-resistant varieties using molecular breeding approaches.

 PDF Links
 PubReader
 ePub Link
 Full text via DOI
 Full text via PMC
 Download Citation
 Supplement
 Print
Print