Plant Pathol J > Volume 39(4); 2023 > Article
Gong and Zhang: An Analysis of Plant Diseases Identification Based on Deep Learning Methods

Abstract

Plant disease is an important factor affecting crop yield. With various types and complex conditions, plant diseases cause serious economic losses, as well as modern agriculture constraints. Hence, rapid, accurate, and early identification of crop diseases is of great significance. Recent developments in deep learning, especially convolutional neural network (CNN), have shown impressive performance in plant disease classification. However, most of the existing datasets for plant disease classification are a single background environment rather than a real field environment. In addition, the classification can only obtain the category of a single disease and fail to obtain the location of multiple different diseases, which limits the practical application. Therefore, the object detection method based on CNN can overcome these shortcomings and has broad application prospects. In this study, an annotated apple leaf disease dataset in a real field environment was first constructed to compensate for the lack of existing datasets. Moreover, the Faster R-CNN and YOLOv3 architectures were trained to detect apple leaf diseases in our dataset. Finally, comparative experiments were conducted and a variety of evaluation indicators were analyzed. The experimental results demonstrate that deep learning algorithms represented by YOLOv3 and Faster R-CNN are feasible for plant disease detection and have their own strong points and weaknesses.

Research on plant diseases has attracted considerable attention over the past decades because they can cause great damage and substantial economic losses in agriculture. Recently, due to the change in global climate and the development of economic globalization, plant diseases become universal with increasing incidence (Wani et al., 2022). Each year, plant diseases cost the global economy over $220 billion (Food and Agriculture Organization of the United Nations, 2021). Effective disease detection can reduce output losses and ensure agricultural sustainability (Tugrul et al., 2022). Hence, it is very essential to improve the ability of plant disease detection to ensure the development of the plant industry. This is a major challenge for implementing agricultural informatization and intelligent industry as well as realizing high-quality, efficient, and safe agricultural production.
Currently, there are four main methods to identify plant diseases. First, the simple and basic way is a visual estimation based on farmers’ own experiences. Owing to the similar appearance of some diseases, it is difficult to judge them with human eyes. The second method refers to the information about the observed changes in the spectral reflectance of healthy and diseased leaves (Karadağ et al., 2020; Sterling and Melgarejo, 2020). Although this is more accurate than visual estimation, the spectrometer is unaffordable for farmers. Another reliable way is the polymerase chain reaction or real-time polymerase chain reaction. This way makes possible an accurate, reliable, and high-throughput quantification of target pathogen DNA in various plant leaves, which shows potential practical application in the diagnostics of plant disease (Alemu, 2014). However, the experimental process is tedious and cannot be applied to a really complex environment (Tamuli, 2020). Driven by the development of the Internet, the automated identification of plant diseases has received significant research interest in agriculture. Disease detection methods based on image processing and computer vision are characterized by low cost, high speed, and high accuracy (Li et al., 2020b). Therefore, this article deals with image-based plant disease identification within the framework of machine learning methods, particularly deep learning.
Disease detection based on imaging processing and computer vision can be regarded as a classification problem consisting of two modules, i.e., feature extraction and classification. According to the different feature extraction methods, plant disease recognition technology is divided into the traditional machine learning algorithms based on manual feature extraction and the disease recognition algorithms based on deep learning. Traditional machine learning algorithms manually extract features, including color co-occurrence matrix (Chang et al., 2012), local binary patterns (Dubey and Jalal, 2012), color features (Jos and Venkatesh, 2020; Shrivastava and Pradhan, 2021), edge features (Taohidul Islam et al., 2019), texture features (Hlaing and Maung Zaw, 2018), and histogram (Pushpa et al., 2021), followed by different classification implementation model including support vector machine, decision trees and k-nearest neighbor (Nandhini and Bhavani, 2020). In addition, feature extraction quality directly affects the accuracy of classification in traditional machine learning algorithms. In particular, the traditional machine learning algorithm has two key limitations in feature extraction. On the one hand, the feature is manually designed. The designer should have sufficient professional knowledge and keen insight to select features suitable for plant disease classification. On the other hand, the selected features are the underlying features of the target. The machine can only use these features for classification. However, the emergence of deep learning has opened a new avenue for plant disease feature selection. From a multilevel network structure, the low-level features of the raw data are extracted and combined. Thus, more complex non-linear high-level features are shown. Features are continuously selected, and the model is optimized to recognize objects automatically. Consequently, deep learning has been widely used in different domains (Bhat et al., 2018; Jia et al., 2019; Simon et al., 2019; Srivastava et al., 2021; Zhang et al., 2020) and has also created great achievements in plant disease identification (Caldeira et al., 2021; Cynthia et al., 2019; Deng et al., 2021; Fernández-Campos et al., 2021; Li et al., 2020a; Liu and Wang, 2020; Mathew and Mahesh, 2022; Tian et al., 2019; Waheed et al., 2020; Wang and Liu, 2021; Wang and Qi, 2019; Yan et al., 2020; Zhang et al., 2019; Zhou et al., 2021).
Convolutional neural networks (CNN) are powerful neural networks designed for processing image data. CNN-based architectures have been dominant in the field of computer vision, and have been employed in almost all academic contests and related commercial applications including image recognition, object detection, and semantic segmentation. As one of the most influential academic competitions in the field of computer vision, the ImageNet Large Scale Visual Recognition Challenge (ILSVRC), has emerged many well-known networks such as AlexNet (Krizhevsky et al., 2012), GoogleNet (Szegedy et al., 2015), VGG (Simonyan and Zisserman, 2015), and ResNet (He et al., 2016). The advantages of CNN in image recognition and detection are particularly prominent, owing to local perception and weight sharing. A CNN can reduce the training time in a large number of repeated calculations by using the GPU’s efficient computing power. It also simplifies the operations of feature extraction and image processing simultaneously.
Similarly, CNN has been a good candidate used for identifying different plant diseases. An improved model was proposed based on VGG16 for identifying apple leaf disease (Yan et al., 2020) and the results achieved an accuracy of 99.01%. Fernández-Campos et al. (2021) developed a deep CNN model, which classifies the severity of wheat spike blasts into three severity categories, and received the highest precision, recall, and F1 score on non-matured and matured wheat spike images. Deng et al. (2021) selected DenseNet-121, SE-ResNet-50, and ResNeSt-50 in an ensemble model for the diagnosis of rice diseases and obtained 91% accuracy. An optimized dense CNN for corn leaf disease classification was proposed by Waheed et al. (2020), which achieves an accuracy of 98.06%. Zhang et al. (2019) compared CNN with traditional classification methods in identifying peach leaves, and their experiment revealed that CNN is significantly superior to other methods. Zhou et al. (2021) presented a restructured residual dense network for tomato leaf disease identification and the highest average recognition accuracy was achieved on the test dataset. Moreover, Caldeira et al. (2021) identified lesions on cotton leaves by GoogleNet and Resnet-50, which obtained precisions of 86.6% and 89.2%, respectively. All these methods collectively call plant disease classification, whose output is just the category of the plant disease. Although plant disease classification based on CNN has reached a certain level of accuracy, there are still some defects and drawbacks.
  1. The datasets are taken in controlled environments and laboratory setups instead of real conditions of cultivation fields, giving rise to poor accuracy in the real world due to the differences in the geographical environment, soil conditions, light changes, and water content, etc.

  2. The classification algorithm can only detect one disease in a picture but cannot detect multiple diseases when the input leaf picture has different plant diseases.

  3. The methods are limited to detecting the types of disease and cannot ascertain the location of diseases, which is adverse to subsequent precise disease control work.

To solve the above problems, an object detection method is given not only to determine the type of disease in a real environment but also to mark the disease position with a bounding box. Since deep learning-based object detection techniques greatly improve classification and localization accuracy, it is useful to use such techniques for identifying plant diseases. Especially, deep CNN-based object detection is a research priority in the field of computer vision, which can be divided into two types. The former depends on the region proposals of the input image, including regions with CNN features (R-CNN) (Girshick et al., 2014), spatial pyramid pooling net (SPP-Net) (He et al., 2015), Fast R-CNN (Girshick, 2015), Faster R-CNN (Ren et al., 2017), and region-based fully convolutional networks (R-FCN) (Dai et al., 2016). These algorithms consist of two stages. First region proposals are obtained from the input image and then classification and regression prediction are performed. The two-stage object detection algorithms have high detection accuracy, especially for small targets, but their detection speed is slow. Thus, it is not feasible to be widely used in real-world applications. The latter is single-stage object detection. Only one step is adopted to predict and classify the target directly, and the model volume is relatively small. Landmark algorithms include the Single Shot MultiBox Detector (SSD) (Liu et al., 2016) and You Only Look Once (YOLO) (Redmon et al., 2016). These methods are simple, fast, and widely used.
Object detection methods have been used for identifying different plant diseases, where the classical algorithms are the Faster R-CNN and YOLO. Wang and Qi (2019) trained and tested the tomato diseased dataset by using Faster R-CNN with three different deep CNN, namely, VGG-16, ResNet-50, and ResNet-101. The results implied that ResNet-101 has the best performance with a mean average precision (AP) of 90.87%. Faster R-CNN was also used for the real-time detection of rice leaf disease. The detection accuracies of rice blast, brown spot, and hispa were 98.09%, 98.85%, and 99.17%, respectively. In addition, Faster R-CNN was trained in the objection detection API to detect diseases from plant leaf images by using Tensorflow and the classification of leaf disease can be specified (Cynthia et al., 2019). Li et al. (2020a) proposed an automatic identification method for balsam pear leaf diseases based on an improved Faster R-CNN, and found good durability and high accuracy in detecting balsam pear leaf diseases compared to other detection methods. Similarly, YOLO has been applied to detect plant diseases. For example, based on an improved YOLOv3 by using image pyramid, tomato disease, and pet detection maintained high accuracy and real-time detection requirements (Liu and Wang, 2020). Wang and Liu (2021) added the idea of dense connection to the YOLOv3 model to detect tomato anomalies and obtained a high detection accuracy and speed. Also, the dense connection idea was utilized in the feature extracted layers of YOLOv3 to detect apple lesions after using data augmentation (Tian et al., 2019), suggesting that the precision of the model exceeds that of Faster R-CNN and the original YOLOv3. Mathew and Mahesh (2022) demonstrated that YOLOv5 can successfully detect the early bacterial spot disease of bell pepper plants and help farmers detect and identify plant diseases in a timely manner.
Motivated by these discussions, the main contributions of this paper are embodied as follows:
  1. A new dataset containing a large number of labeled images of plant disease under the real natural environment is proposed, i.e., apple leaf disease datasets (ALDD).

  2. Two object detection methods (Faster R-CNN and YOLOv3) are used to detect plant disease.

  3. Disease detection results are analyzed for ALDD with different models.

The remainder of this paper is structured as follows. The acquisition of the dataset, disease detection methods, and the evaluation metrics is introduced in Section 2. In Section 3, comparative experiments based on the methods are presented. Finally, some discussions are drawn in Section 4.

Materials and Methods

Dataset

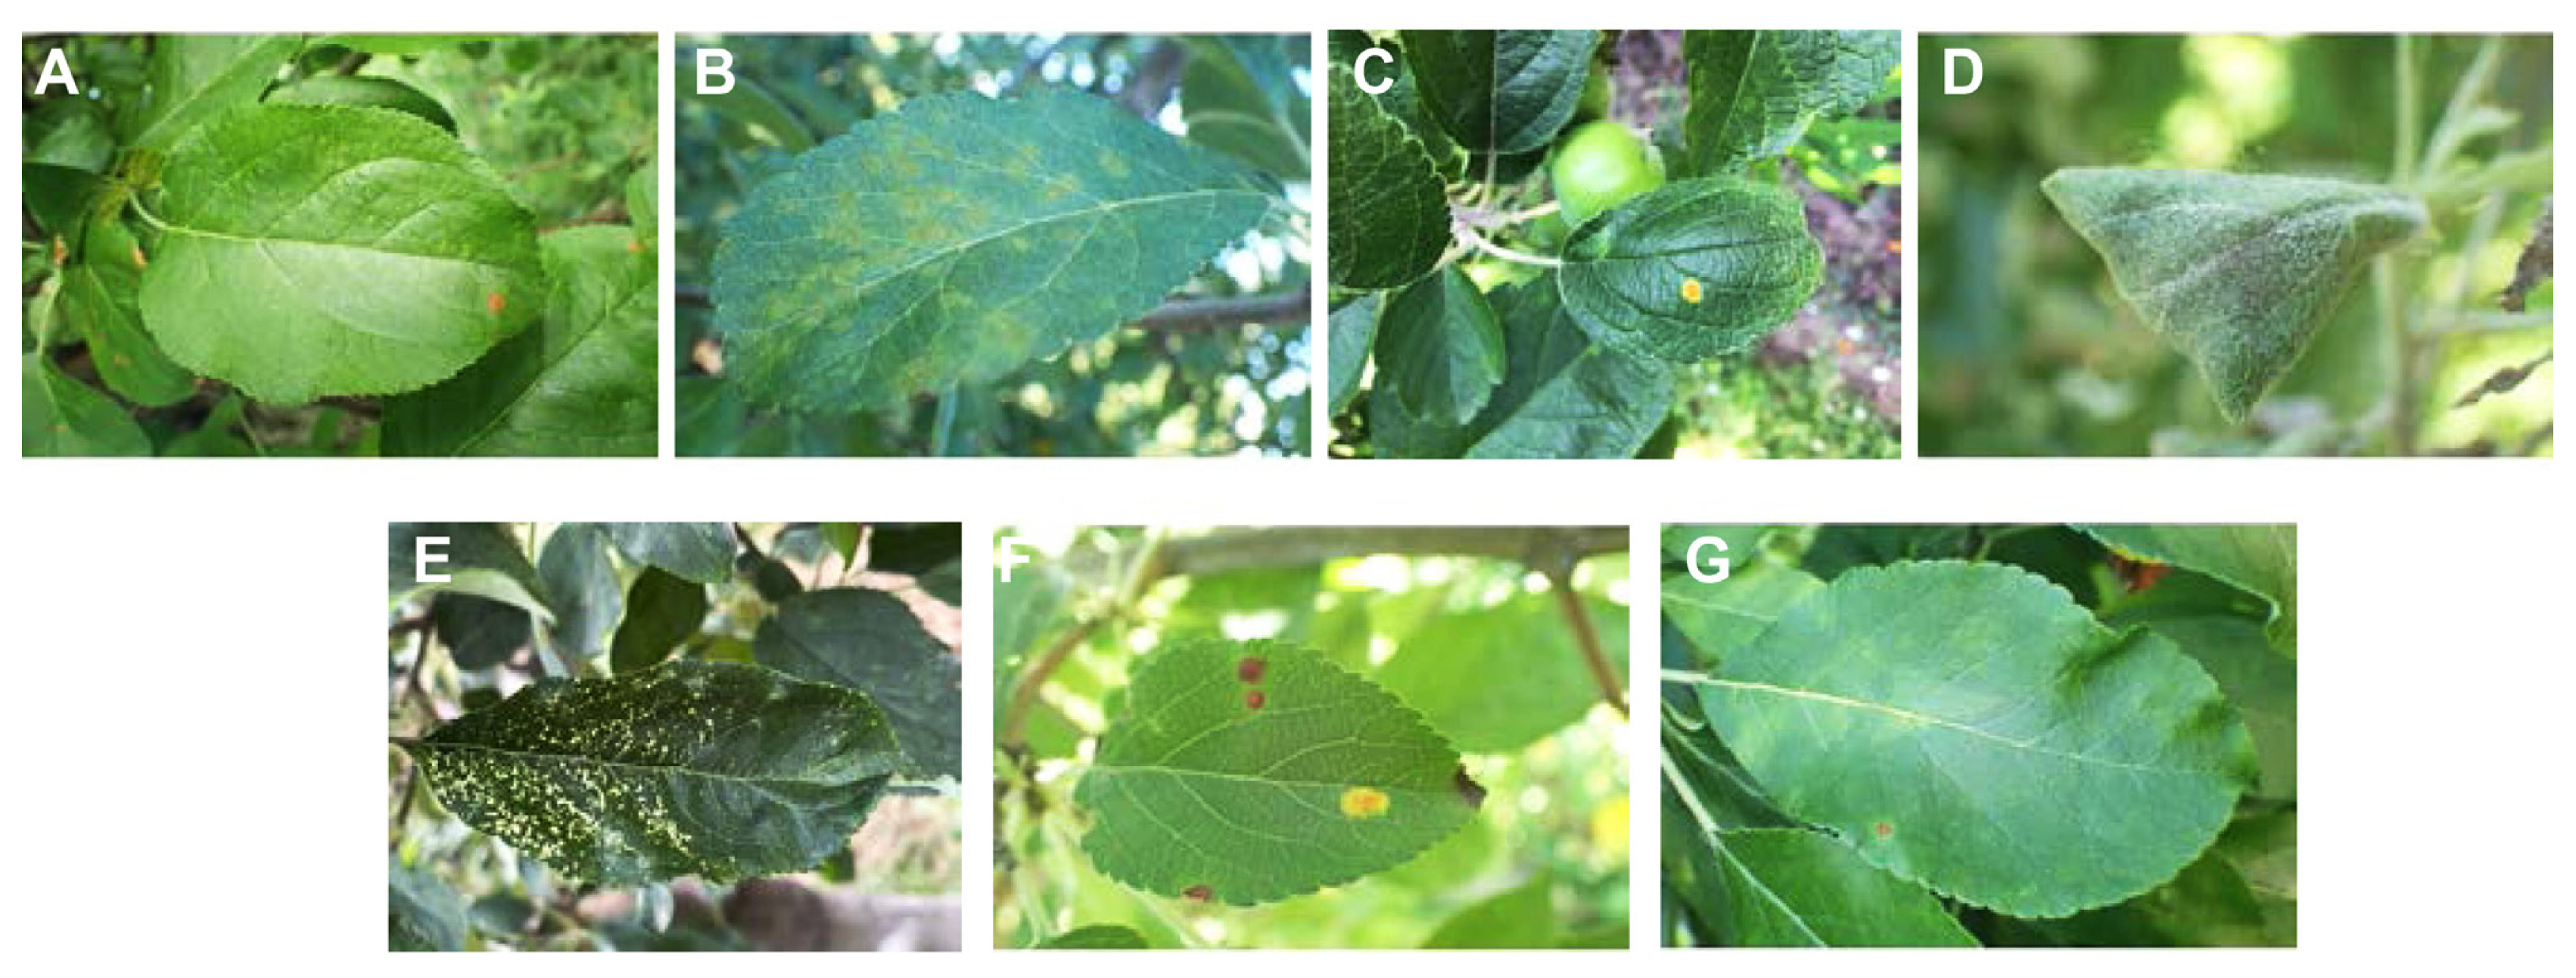
Plant disease datasets are the basis of our research. We constructed an apple leaf disease dataset containing five kinds of leaf diseases, including scab, frogeye leaf spot, rust, powdery mildew, and mosaic, of whose scientific names are Venturia inaequalis, Sphaeropsis malorum, Gymnosporangium juniperi-virginianae, Podosphaera leucotricha, and Apple mosaic virus, respectively. The first four diseases are all from the Plant Pathology 2021-FGVC8 challenge competition (Thapa et al., 2020). Of the 378 mosaic diseases, 237 were taken by us and 105 were from the online public dataset (AI Studio, 2019). Smartphones were used to capture these pictures at the Pomology Institute of Shanxi Agricultural University and farmers’ orchards. They are all non-uniform apple leaf images taken at different maturity stages and different times of the day in real-field scenarios. Besides, the online public dataset contains high-quality images of apple mosaic from real field backgrounds. To meet the experimental requirements, we also selected some pictures of multiple diseases on one leaf. Representative apple leaves are shown in Fig. 1.

Image preprocessing

A total of 2,084 apple disease images were selected to make up our dataset. The LabelImg tool was used to label the classes and positions of the object spots in the diseased images to complete the object detection task. Fig. 2 shows an example of frogeye leaf spot infected apple leaf annotation, the disease spot is surrounded by a box in the annotated image of Fig. 2A, and Fig. 2B displays the core information of the corresponding XML file, including the image size, lesion name, and lesion location determined by the lower right and upper left coordinates of the box. Agricultural experts manually marked and verified all images in the dataset, so that all images were correctly labeled. To facilitate the model training, the image size is uniformly conformed to 640 × 480. The dataset constructed was ALDD.
To meet the experimental needs, the annotated sample images are divided into three parts, i.e., training set, validation set, and test set, which are randomly divided in the ratio of 8:1:1 with reference to Bhujel et al. (2022). The specific numbers for each category are depicted in Table 1. To increase the diversity of the dataset and improve the generalization ability of the model, an online data enhancement strategy is adopted for the training set. The online data enhancement refers to various transformations of images during the training process, the specific methods are illustrated in Fig. 3.

Plant disease detection models

The purpose of our paper is to elaborate on a simplified plant disease detection method leveraging deep learning algorithms. The proposed framework should be able to detect the types and locations of diseases in different plants. Additionally, each kind of plant disease is regarded as a distinguishable object. By fine-tuning the parameters, the proposed method can be employed for other similar plant diseases. In order to learn the visual and texture patterns of each plant disease, Faster R-CNN and YOLOv3 are developed. A detailed description of the two object detection algorithms is as follows.

Faster R-CNN

Faster R-CNN is a deep convolutional network used for object detection. It is the last algorithm in the region-based CNNs series after R-CNN and the Fast R-CNN. These are all two-stage object detection algorithms. In order to display Faster R-CNN, we will introduce R-CNN and Fast R-CNN first. R-CNN uses selective search to extract multiple high-quality region proposals from the input image. Each region proposal is marked with a class and a box. After being resized to a fixed predefined size, a CNN is selected for feature extraction by forward propagation for each region proposal. Finally, the output features are classified and regressed. R-CNN innovatively extracts features based on CNN. However, each region proposal independently extracts features in the CNN, and multiple networks need to be trained. These complex and time-consuming computing loads occupy too many resources. Therefore, running R-CNN in real-time is impossible.
Fast R-CNN surmounts several difficulties in R-CNN. Compared with R-CNN, Fast R-CNN not only greatly improves the speed, but also improves the accuracy. Unlike R-CNN, the entire image is fed into CNN instead of region proposals. Then, region proposals are mapped to the regions of interest (ROI) on the CNN output. From these ROIs, the ROI pooling layer extracts the same shape features to facilitate the output. Finally, some fully-connected layers are used to transform the concatenated features. The output of the last fully-connected layers is spilt into 2 branches, one of which is the softmax layer to predict the class, and the other one predicts the bounding boxes of these region proposals. Fast R-CNN shares computations across all proposals instead of executing each proposal’s computation individually, making Fast R-CNN faster than R-CNN. Besides, Fast R-CNN requires less storage space and is more accurate than R-CNN. Despite its advantages, the critical drawback of Fast R-CNN is that the region proposal is extracted using selective search, which consumes most of the object detection time. Besides, the selective search methods cannot be customized for a specific object detection task.
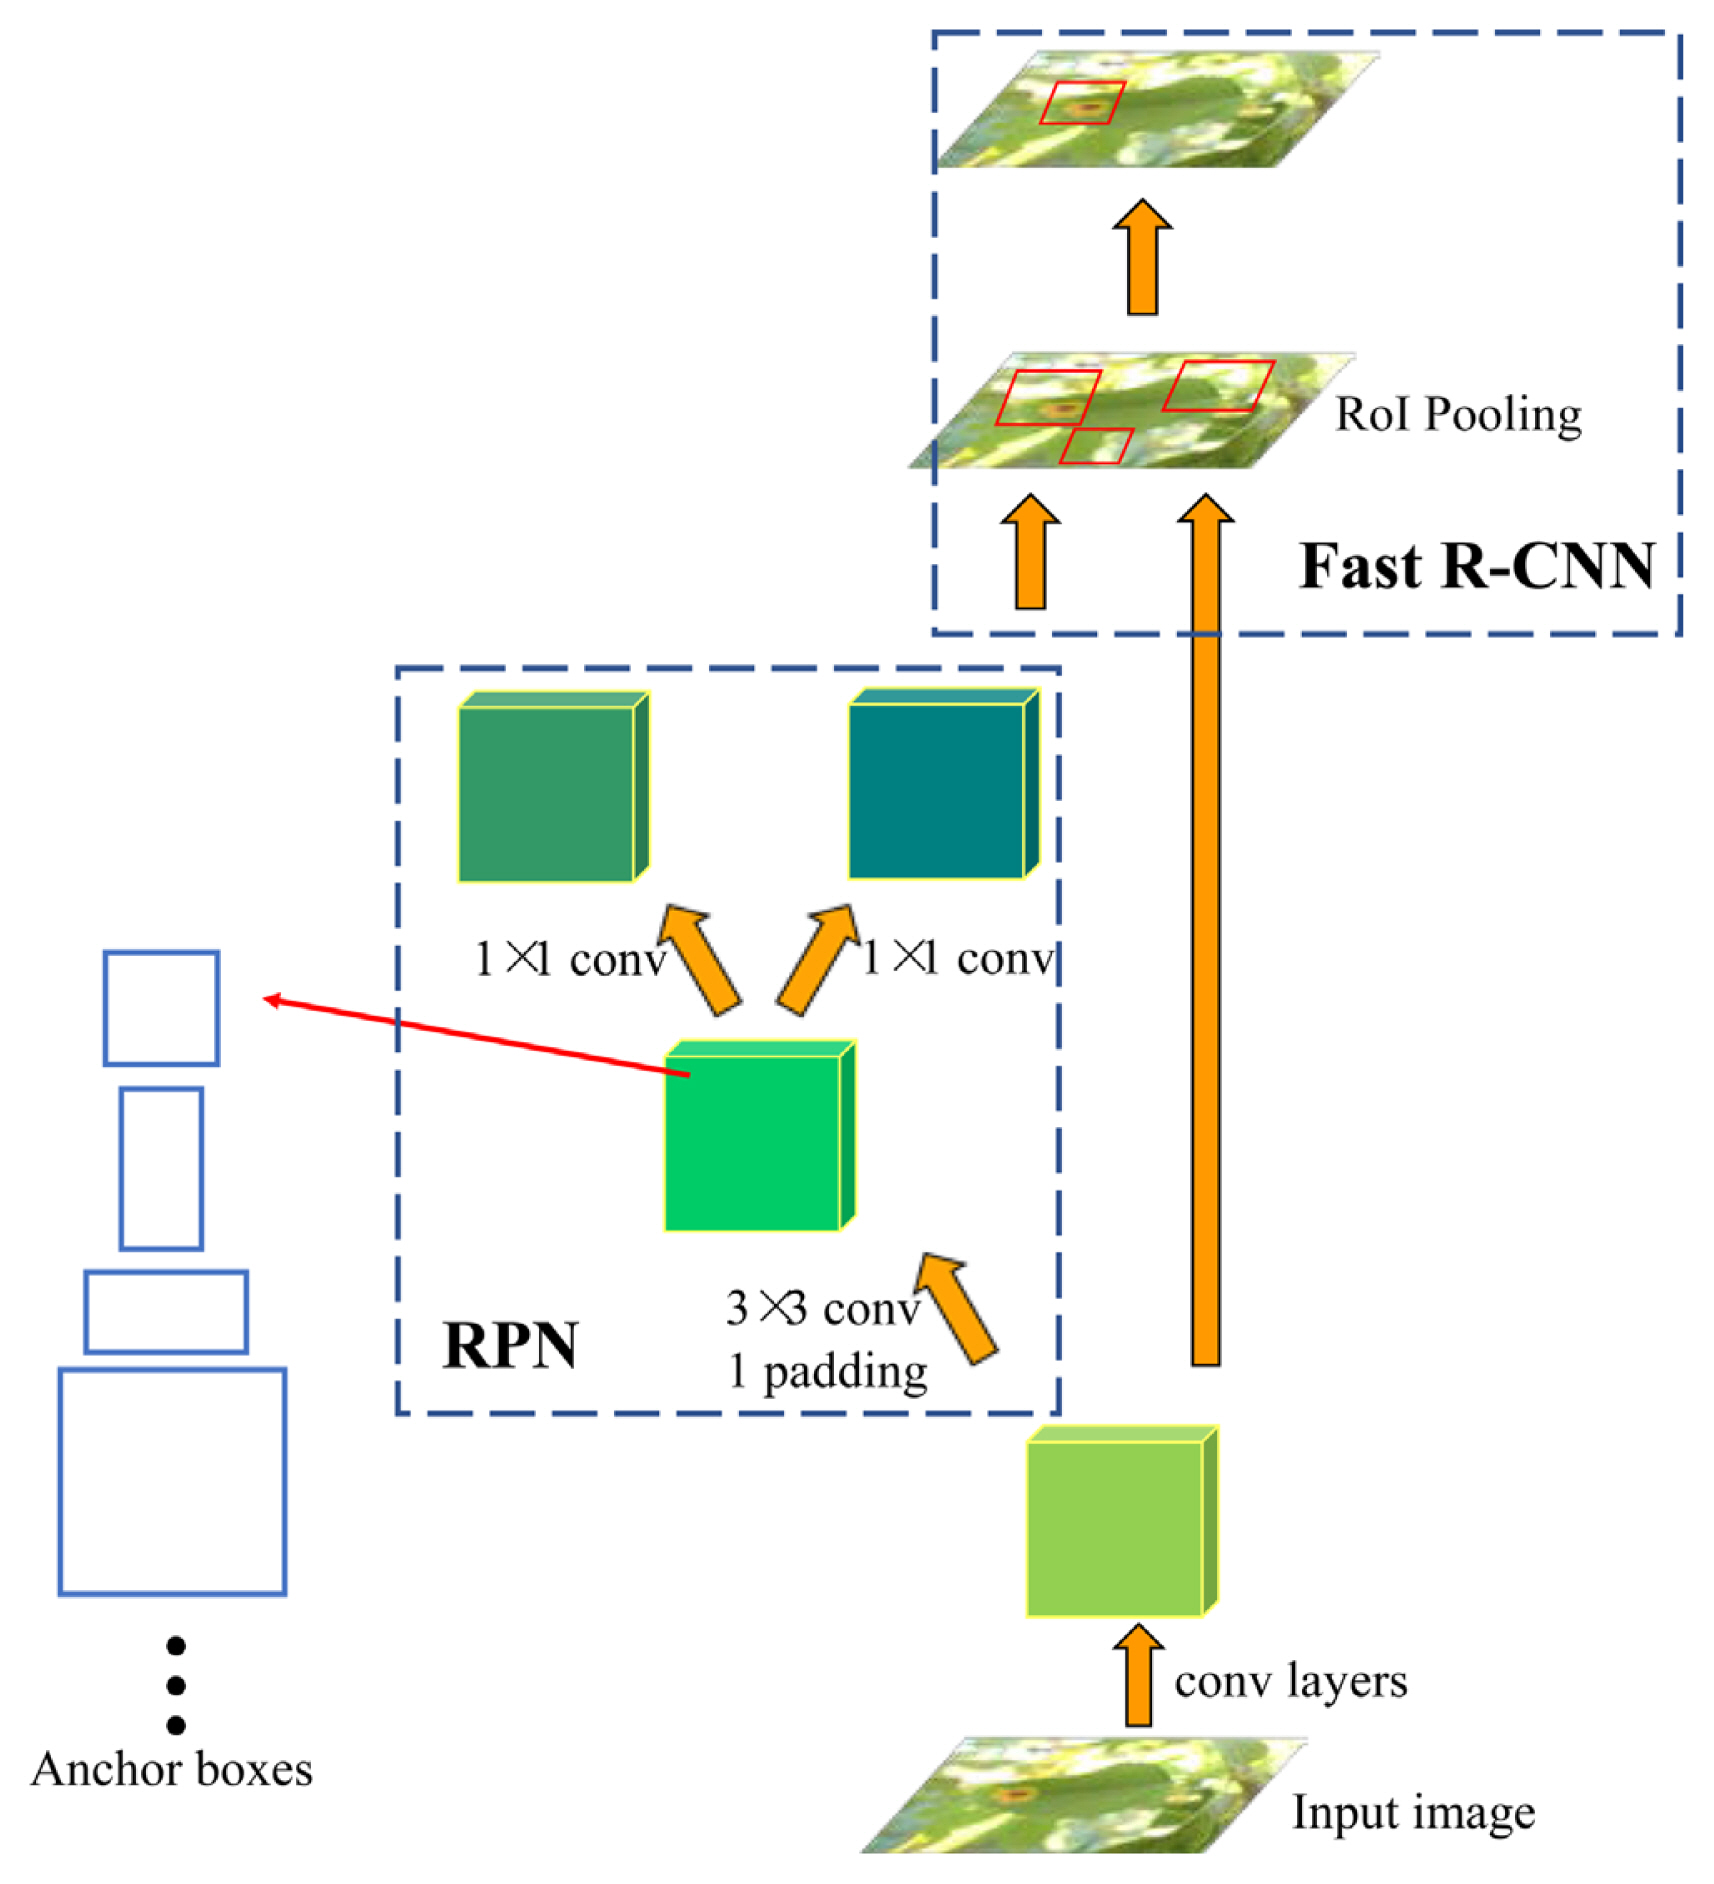
In order to detect objects more accurately, Faster R-CNN is proposed. Thanks to the region proposal network (RPN), the speed of Faster R-CNN is faster than that of Fast R-CNN. The architecture of Faster R-CNN is shown in Fig. 4. It consists of two models: RPN and Fast R-CNN. RPN is responsible for generating region proposals, and Fast R-CNN is used to detect objects in the proposed regions. The RPN operates according to the following steps.
  1. By using a 3 × 3 convolutional layer with padding of 1, the CNN output was converted into a new feature vector with channel c.

  2. Centered on each pixel of the feature map, a set of anchor boxes is formed with a specified size and aspect ratio.

  3. Predict the binary class (background or object) and bounding box of each anchor box by two 1 × 1 convolutional layers.

  4. Using non-maximum suppression (NMS), similar results are removed from the predicted bounding box whose predicted classes are objects. The rest of the predicted bounding boxes are the region proposals of RoI pooling layer.

Then, the region proposals generated by the RPN are used to train the Fast R-CNN combined with the CNN output. As we can see, proposals with multiple scales and aspect ratios are generated by RPN. In other words, the region proposals can be customized based on the detection task. This is more accurate in object detection compared to generic region proposal methods. Since the RPN and Fast R-CNN share the same convolutional layers, they can be unified into a single network, which leads to an end-to-end training process, as shown in Fig. 4. This also reduces the computational time required.

YOLOv3

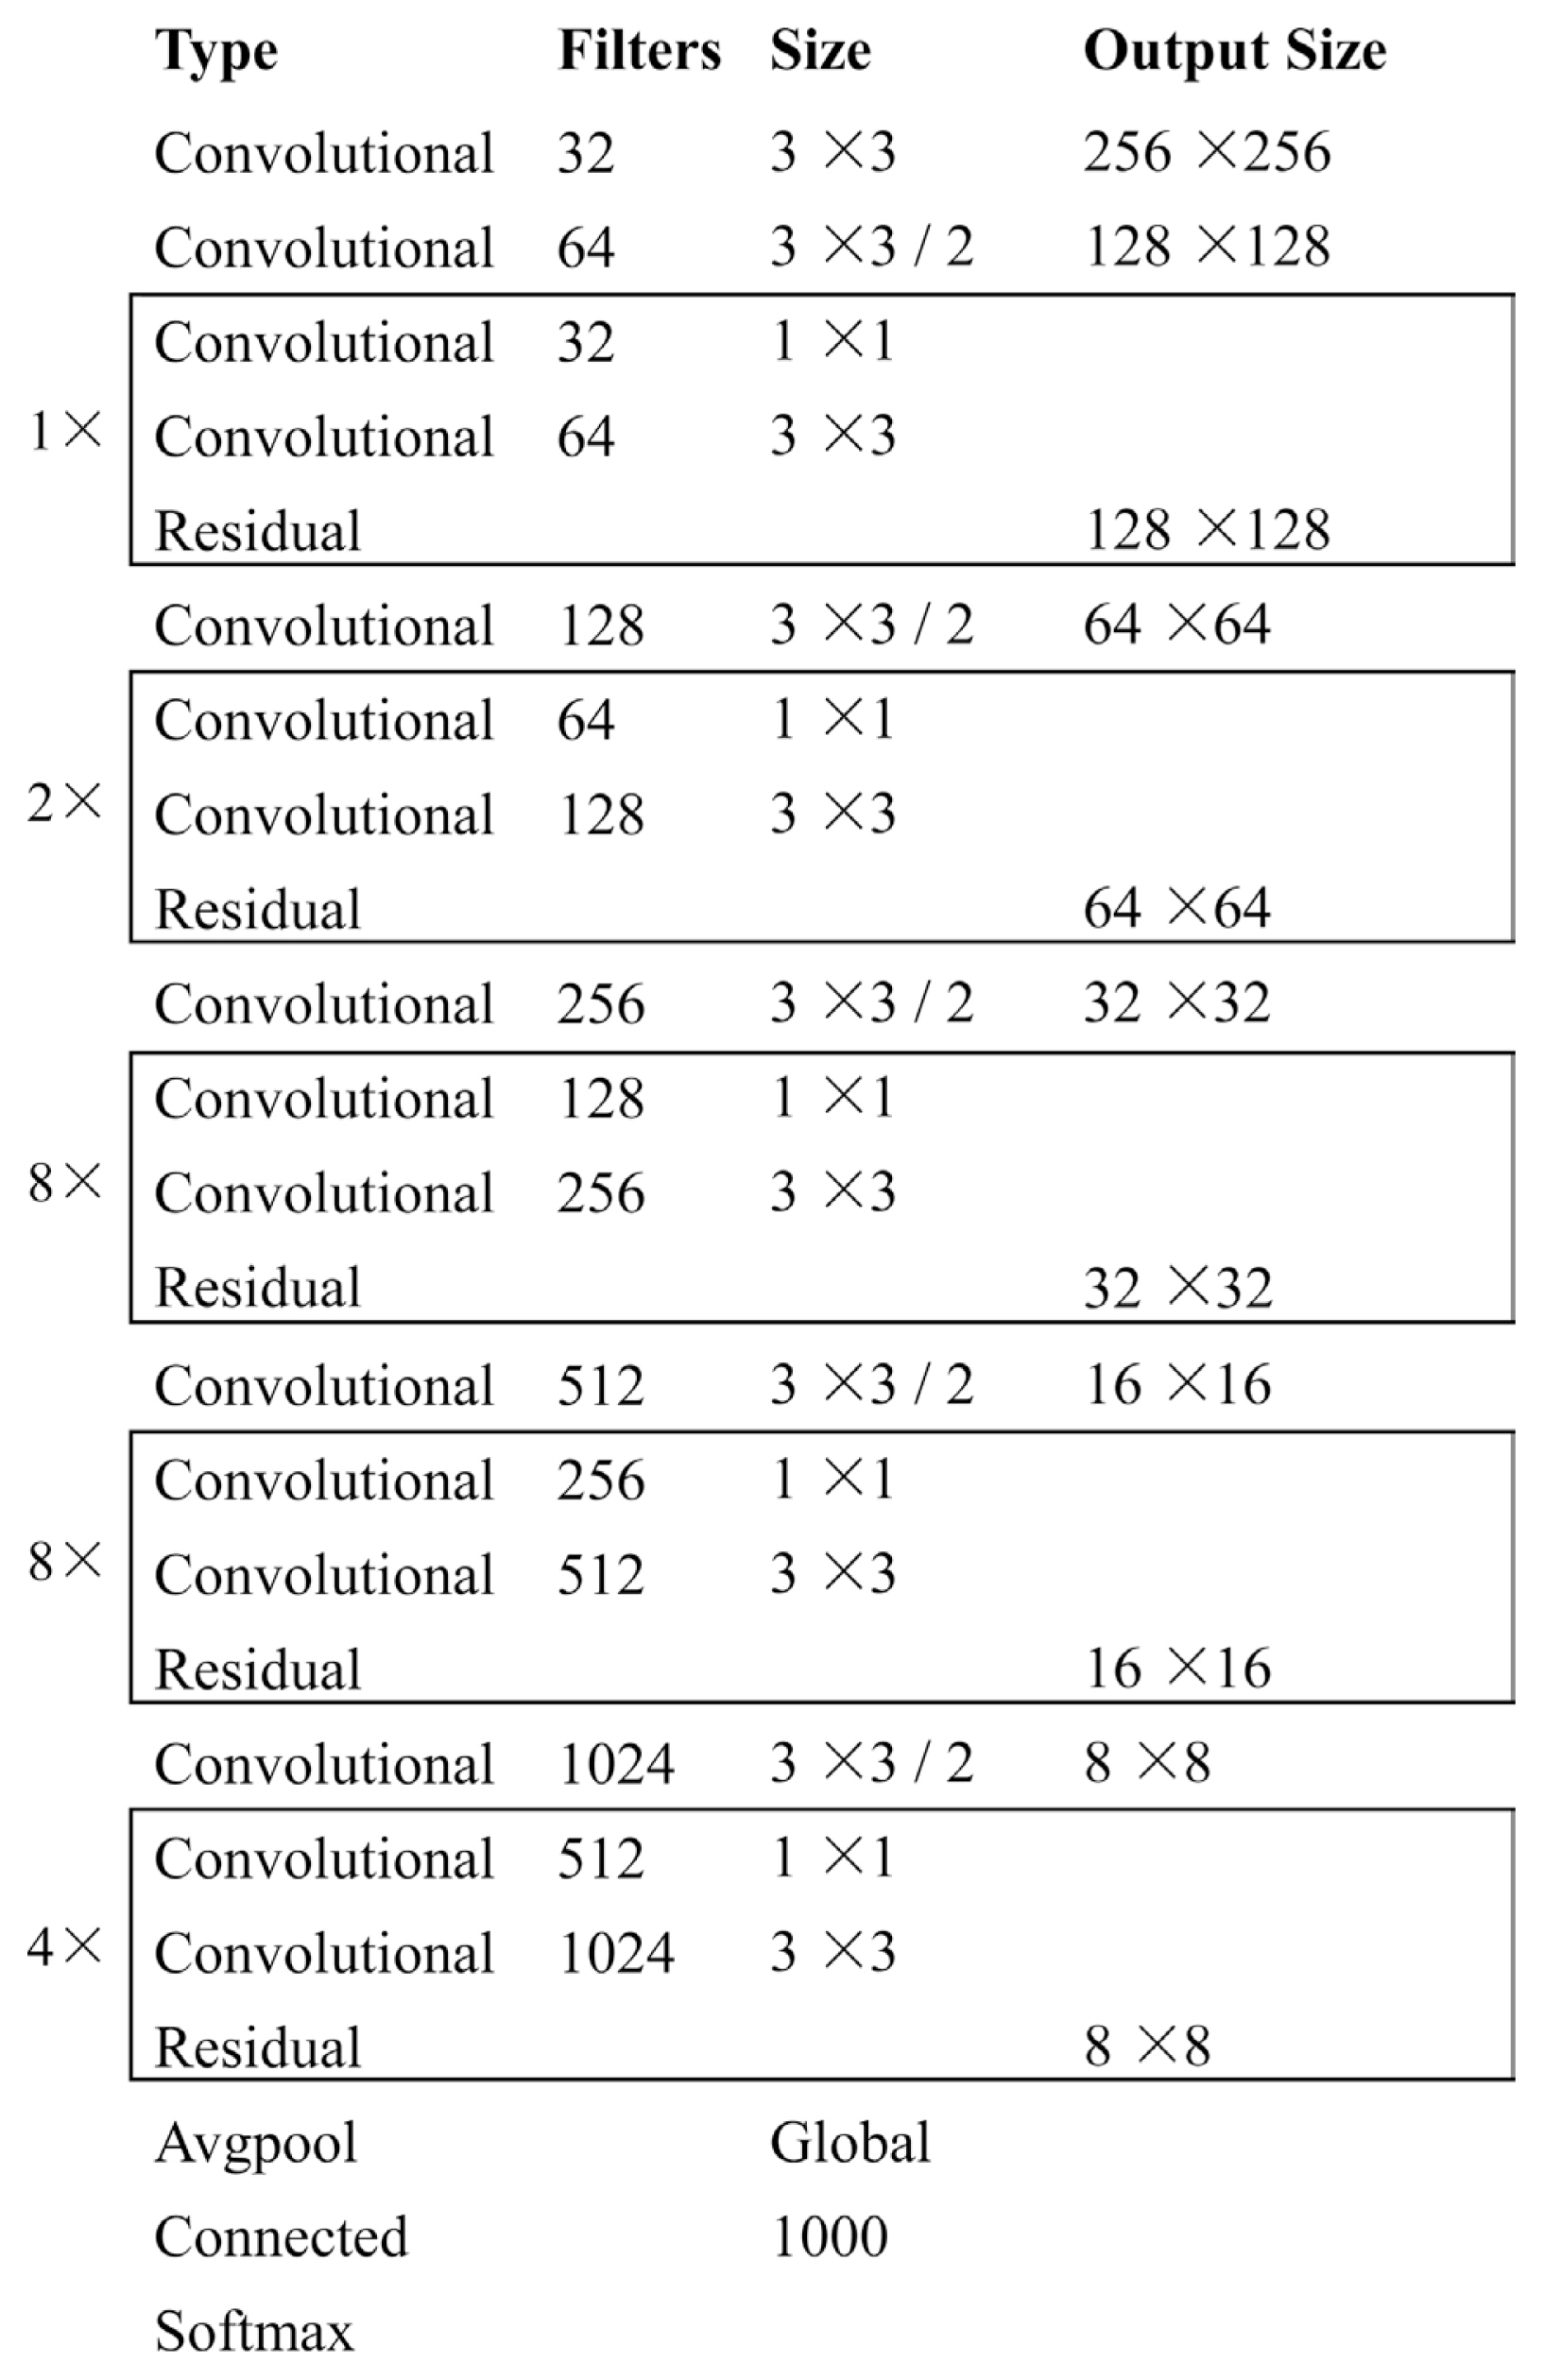
YOLO stands for You Only Look Once. YOLOv3 (Redmon and Farhadi, 2018) algorithm is proposed on the basis of YOLOv2 (Redmon and Farhadi, 2017), and YOLOv2 is an improvement of YOLO. Compared with YOLOv2, the accuracy of YOLOv3 is significantly improved, and the speed is maintained. YOLO algorithm transforms the object prediction problem into a regression problem instead of detecting ROI from region proposal as in Faster R-CNN. YOLOv3 adopts the Darknet53 network architecture, which integrates multiple residual modules and multi-scale feature map information to predict objects. DarkNet53 contains 53 convolutional layers. The main body of YOLOv3 consists of five residual blocks, which reduce the risk of gradient vanishing or gradient explosion. It also strengthens the learning ability of the network. Fig. 5 shows the Darknet-53 network structure.
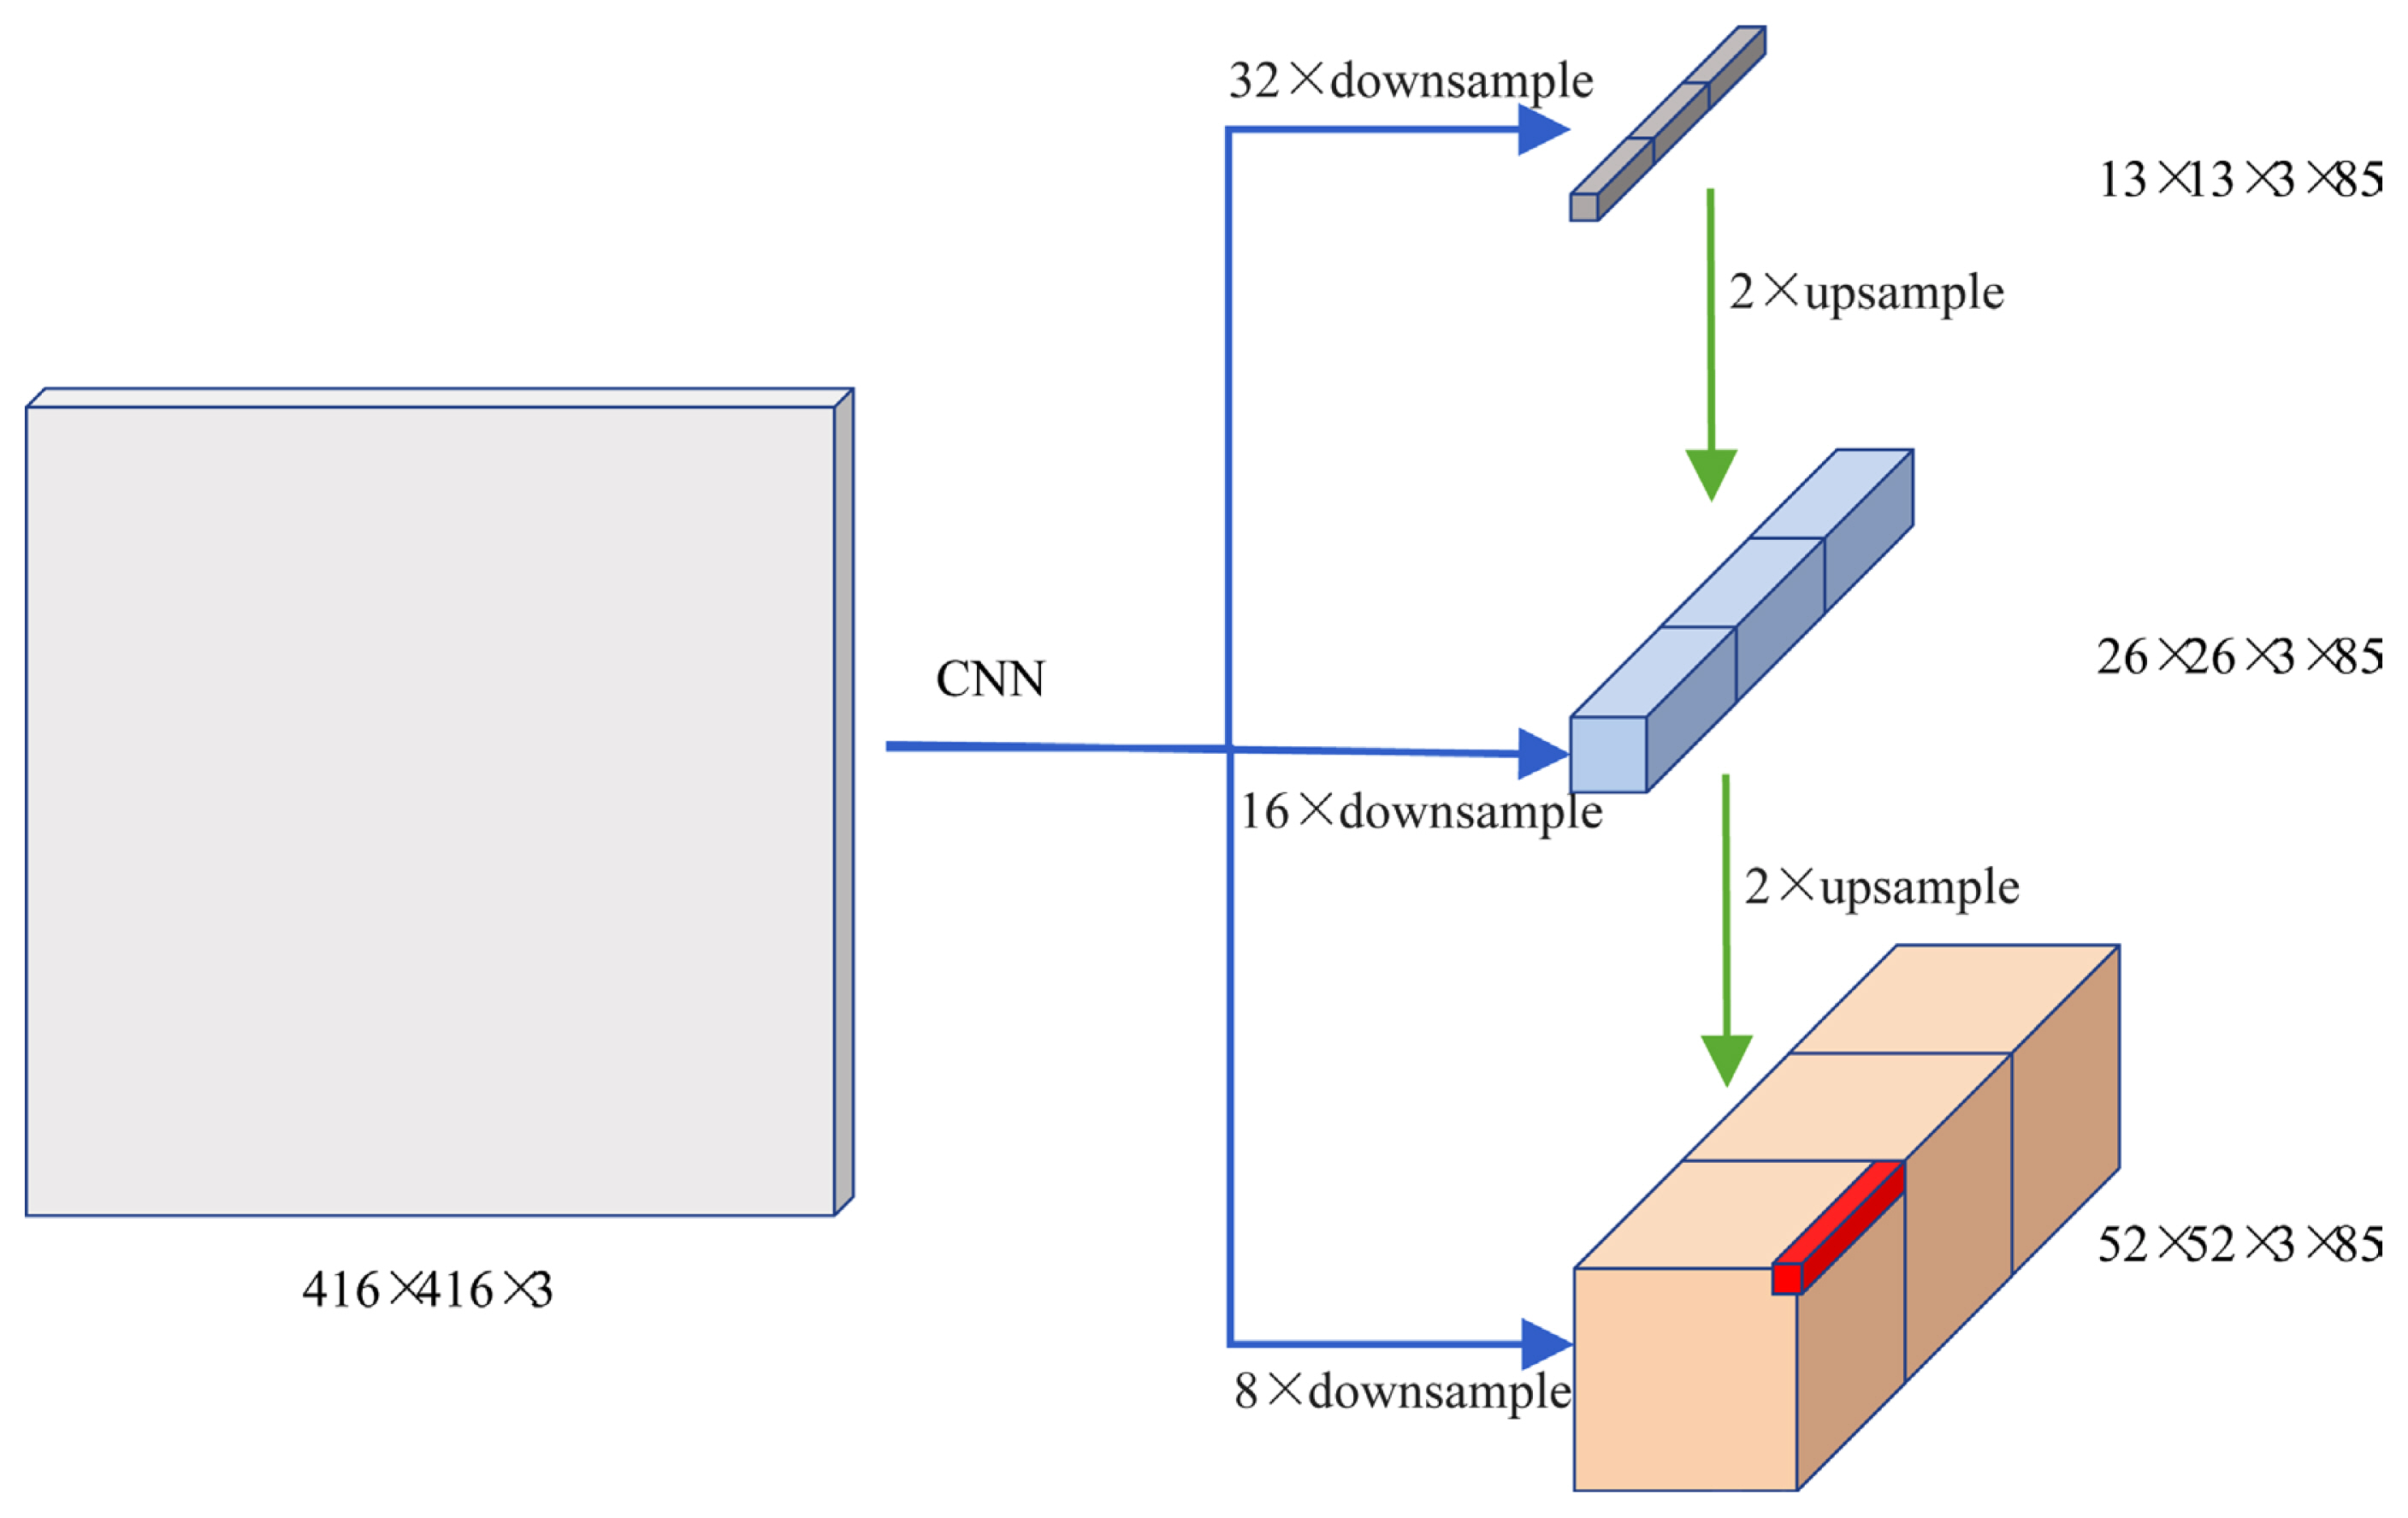
YOLOv3 has only convolutional layers and is a fully convolutional network (FCN). As an FCN, YOLOv3 has nothing to do with the input image size; however, in practice, the input size is generally fixed to prevent various problems that only occur when we train the model. The FCN downsamples the input image with a certain stride of the network. That is, a feature map is obtained as the output. For example, an input image of size 416 × 416 yields an output feature map of size 13 × 13 if the stride of the network is 32. Then, we obtain (B × (5 + C)) entries for each neuron in the feature map, where B denotes the bounding boxes’ number that each neuron can predict and C denotes the class numbers in the dataset. In fact, each neuron of the feature map predicts B bounding boxes, and each bounding box has 5 + C attributes. These items include the center point coordinates, width, height, object score, and the class confidence of each bounding box.
YOLOv3 has three predefined default bounding boxes centered on each neuron of the feature map, which calls anchors, too. In order to train the YOLOv3 model, we need to predict the offsets and classes of each anchor box. Assign the ground-truth bounding box to the anchor box when the Intersection of Union (IoU) value of the ground-truth bounding box and the anchor box meet certain threshold conditions. After that, the class and offset of each anchor box are labeled. On the one hand, label the class of the anchor box with that of the ground-truth bounding box assigned to it. On the other hand, label the offset of the anchor box based on the relative position to the anchor box. Then, multiple anchor boxes are generated, as well as classes and offsets for each of them. The following formulas describe how the network output is transformed to obtain bounding box predictions,
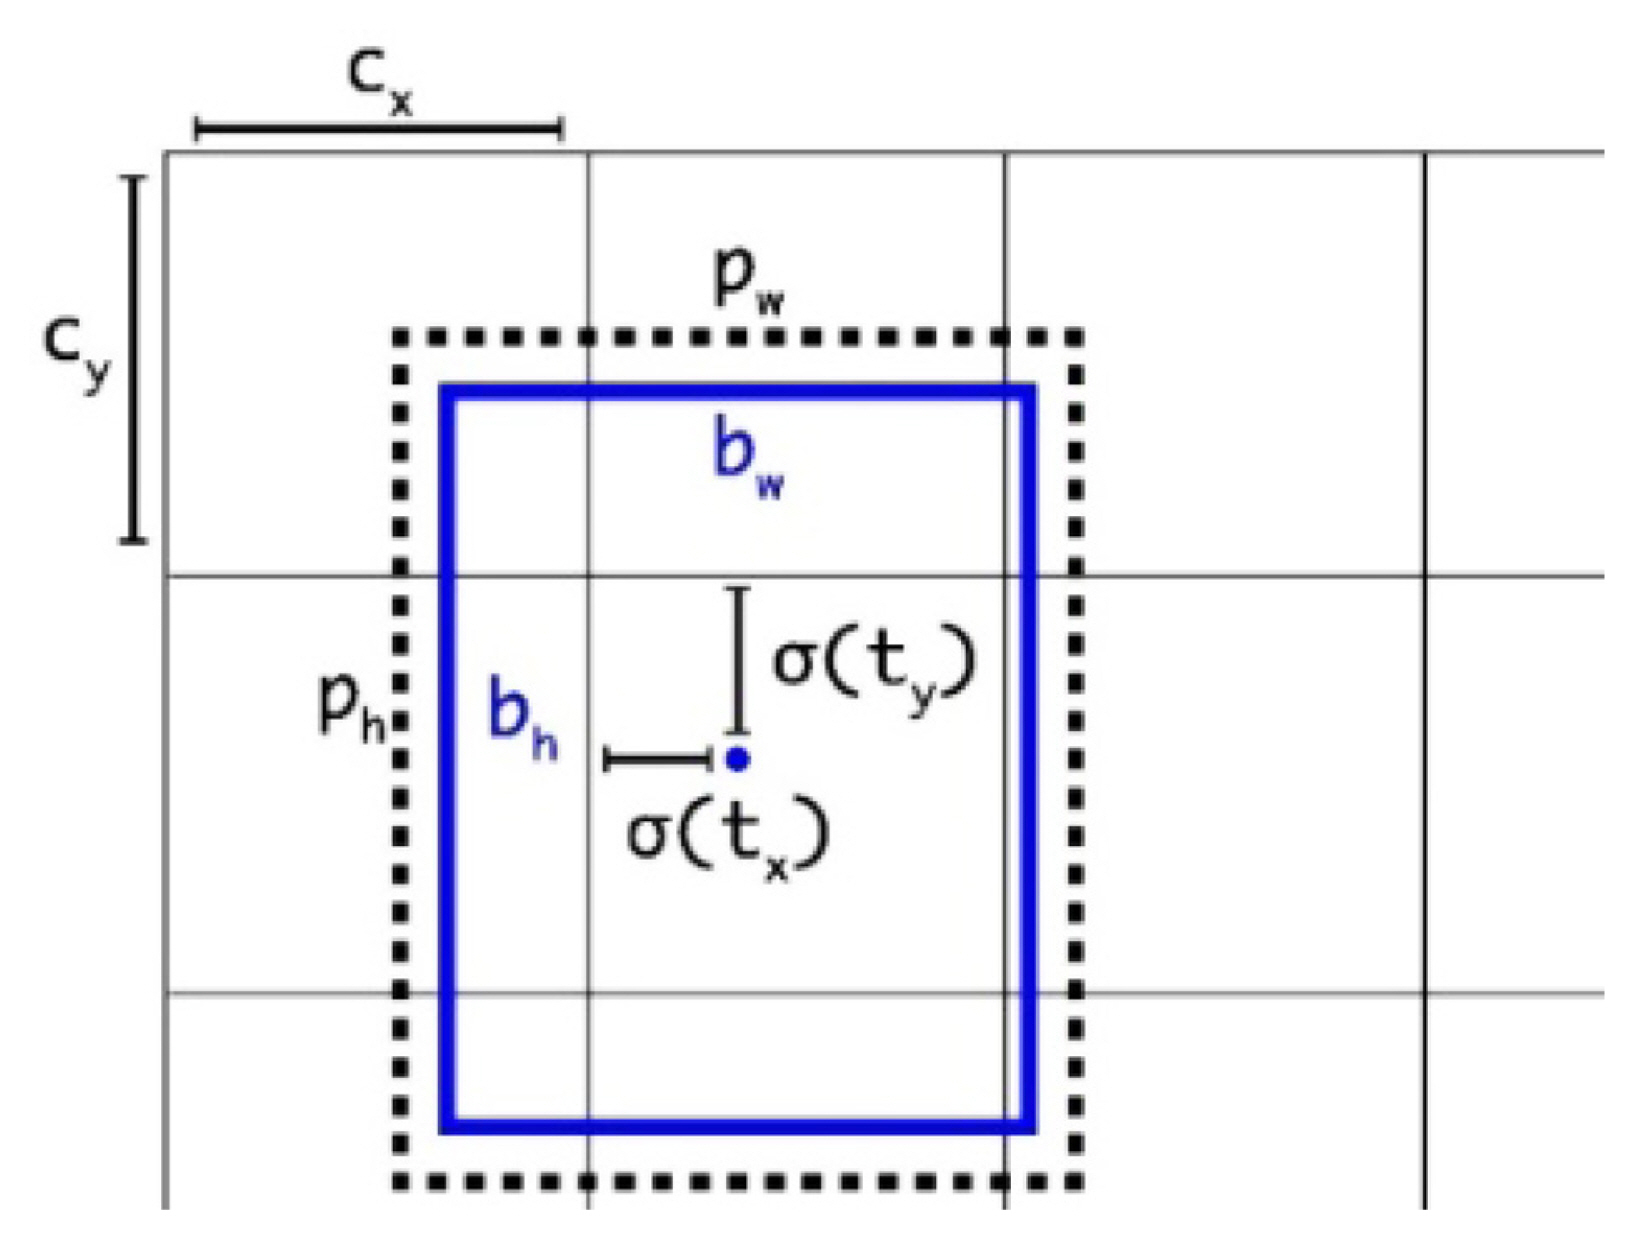
bx=σ(tx)+cx,by=σ(ty)+cy,bw=pwetw,bh=pheth,
Where bx, by, bw, and bh are the center coordinates, width, and height of our prediction tx, ty, tw, and th are the center coordinates, width, and height of the network outputs, cx and cy are the top-left coordinates of the feature map, pw and ph are the width and height of anchor box in feature map scale, s(x) is a sigmoid function. Fig. 6 shows the relationship between them.
YOLOv3 makes predictions across three different scales. Feature maps of three different sizes with strides of 32, 16, and 8 are used for detection. For example, for an image input of 416 × 416 size, detection is performed on the scales of 13 × 13, 26 × 26, and 52 × 52. Finally, ((52 × 52) + (26 × 26) + 13 × 13)) × 3 = 10,647 bounding boxes are predicted for the image, as shown in Fig. 7. To simplify the output, NMS is used to merge similar predicted bounding boxes belonging to the same object. In addition, YOLOv3 opts for the sigmoid activation function instead of the softmax activation function as confidence, which represents the probability of the detected object belonging to a particular class. Thus, the network is more flexible by canceling the mutual exclusion between categories.

Experiment setup

Experiment platform

For a fair comparison, all experiments are implemented based on MMDetection (Chen et al., 2019). Ubuntu 18.04.5 LTS 64-bit system is chosen as the software environment platform. AMD Ryzen 5 5600X 6-core processor and GeForce RTX 3060 Lite Hash Rate is installed respectively. The programming language is Python 3.8 and the deep learning framework is PyTorch 1.10.1.

Model configuration

During training with Faster R-CNN, ResNet-50 is used as the backbone network for image feature extraction. Feature pyramid network (FPN) (Lin et al., 2017) is applied for feature fusion to obtain feature maps at different scales. RPN network is employed to predict object bounds and object scores at each position of the feature maps. In order to feed the feature map into the following Fast R-CNN network, the ROI Align layer (He et al., 2017) is used to change the size of the feature map to a specified size.
DarkNet-53 is the feature extraction network when YOLOv3 is applied to detect apple leaf diseases. The stochastic gradient descent algorithm is used to calculate the gradient of the loss function and iteratively update the weights and bias terms. Instead of training these models from scratch, transfer learning is employed. Pre-trained weights on large-scale COCO datasets are used. The other parameter settings during training are listed in Table 2.

Experiment evaluation

To verify the stability and reliability of our models, several standard metrics are applied to evaluate the efficiency after the model training is completed, which include AP, average recall (AR), and others. Specifically, AP and AR calculated by the following formula, respectively:
AP=IoUthr=0.50:0.50:0.95P/10,AR=IoUthr=0.50:0.50:0.95R/10,P=TP/(TP+FP),R=TP/(TP+FP),
where P represents the precision, and R means the recall, IoUthr stands for IoU thresholds, 0.50:0.05:0.95 is the values from 0.50 to 0.95 with an interval of 0.05, true positive, false positive, false negative denote the number of object correctly predicted, falsely predicted and missed, respectively. Further, precision and recall are a pair of contradictory measures. Thus, AP and AR evaluation metrics both assess the result of detection method from different points of view. Besides, AP50 and AP75 (AP at IoU threshold 0.5 and 0.75), APS/ARS, APM/ARM and APL/ARL (AP/AR for objects of small, medium, and large scales), ARdet 1, ARdet 10, and ARdet 100 (AR given 1, 10, and 100 detections per image) are all selected to evaluate the effectiveness of our models.

Results

The detection accuracy comparison

The performance metrics of each model are tabulated in Tables 3 and 4, respectively. From Tables 3 and 4, we observe that both Faster R-CNN and YOLOv3 can detect apple leaf diseases with high AP and AR values. Besides, YOLOv3’s AP value is 0.4% higher than Faster R-CNN’s AP value, but the AP50 and AP75 of YOLOv3 are lower than those of Faster R-CNN. This indicates that when the IoU is between 0.50 and 0.75, the detection accuracy of YOLOv3 can be higher than that of Faster R-CNN. It is obvious that APS is smaller than APM, and APM is smaller than APL in both models, indicating that the smaller the size of the object, the more difficult it is to detect. The same instance to ARS, ARM, and ARL in Table 4. We can also see that YOLOv3 has an advantage in detecting large objects compared to Faster R-CNN, but its accuracy in detecting small and medium objects is relatively inferior. Furthermore, ARdet 1, ARdet 10, and ARdet 100 are larger than those of Faster R-CNN, meaning that the recall rate of YOLOv3 is relatively high.

Specific class detection accuracy comparison

To compare the detection results of the five apple diseases, the AP50 results for the five apple diseases obtained by our methods is displayed in Table 5. As shown in Table 5, Faster R-CNN achieves a more accurate disease detection in detecting frogeye leaf spot, powdery mildew, and rust. While recognizing scab and mosaic, YOLOv3 has a greater detection advantage over Faster R-CNN. According to the definition of the small target, that is, the ratio of target width and height to the original image width and height is less than 0.1. It can be seen from Table 6 that frogeye leaf spot and rust are small target diseases. In other words, Faster R-CNN has a higher accuracy in detecting small targets than YOLOv3, which is consistent with the higher APs of Faster R-CNN in the previous experiments. This gain can mainly be attributed to the FPN in the Faster R-CNN model, which can generate multi-scale feature representation with strong semantic information for all levels of feature maps compared to the YOLOv3 algorithm.
In fact, there are also clear differences in the category results, as shown in Table 5. More specifically, rust seems to be the hardest to detect, with the lowest AP50 value. This is because small diseases are more difficult to detect than large ones. Moreover, frogeye leaf spot and rust are difficult to recognize due to the large within-class differences including the shade of color and the size of lesions. Meanwhile, the recognition accuracy of the mosaic for the two models is the highest. Because there is little variation among the lesion patterns infected by mosaic, the lesion appearance differs substantially from those of other diseases.

Confusion matrix

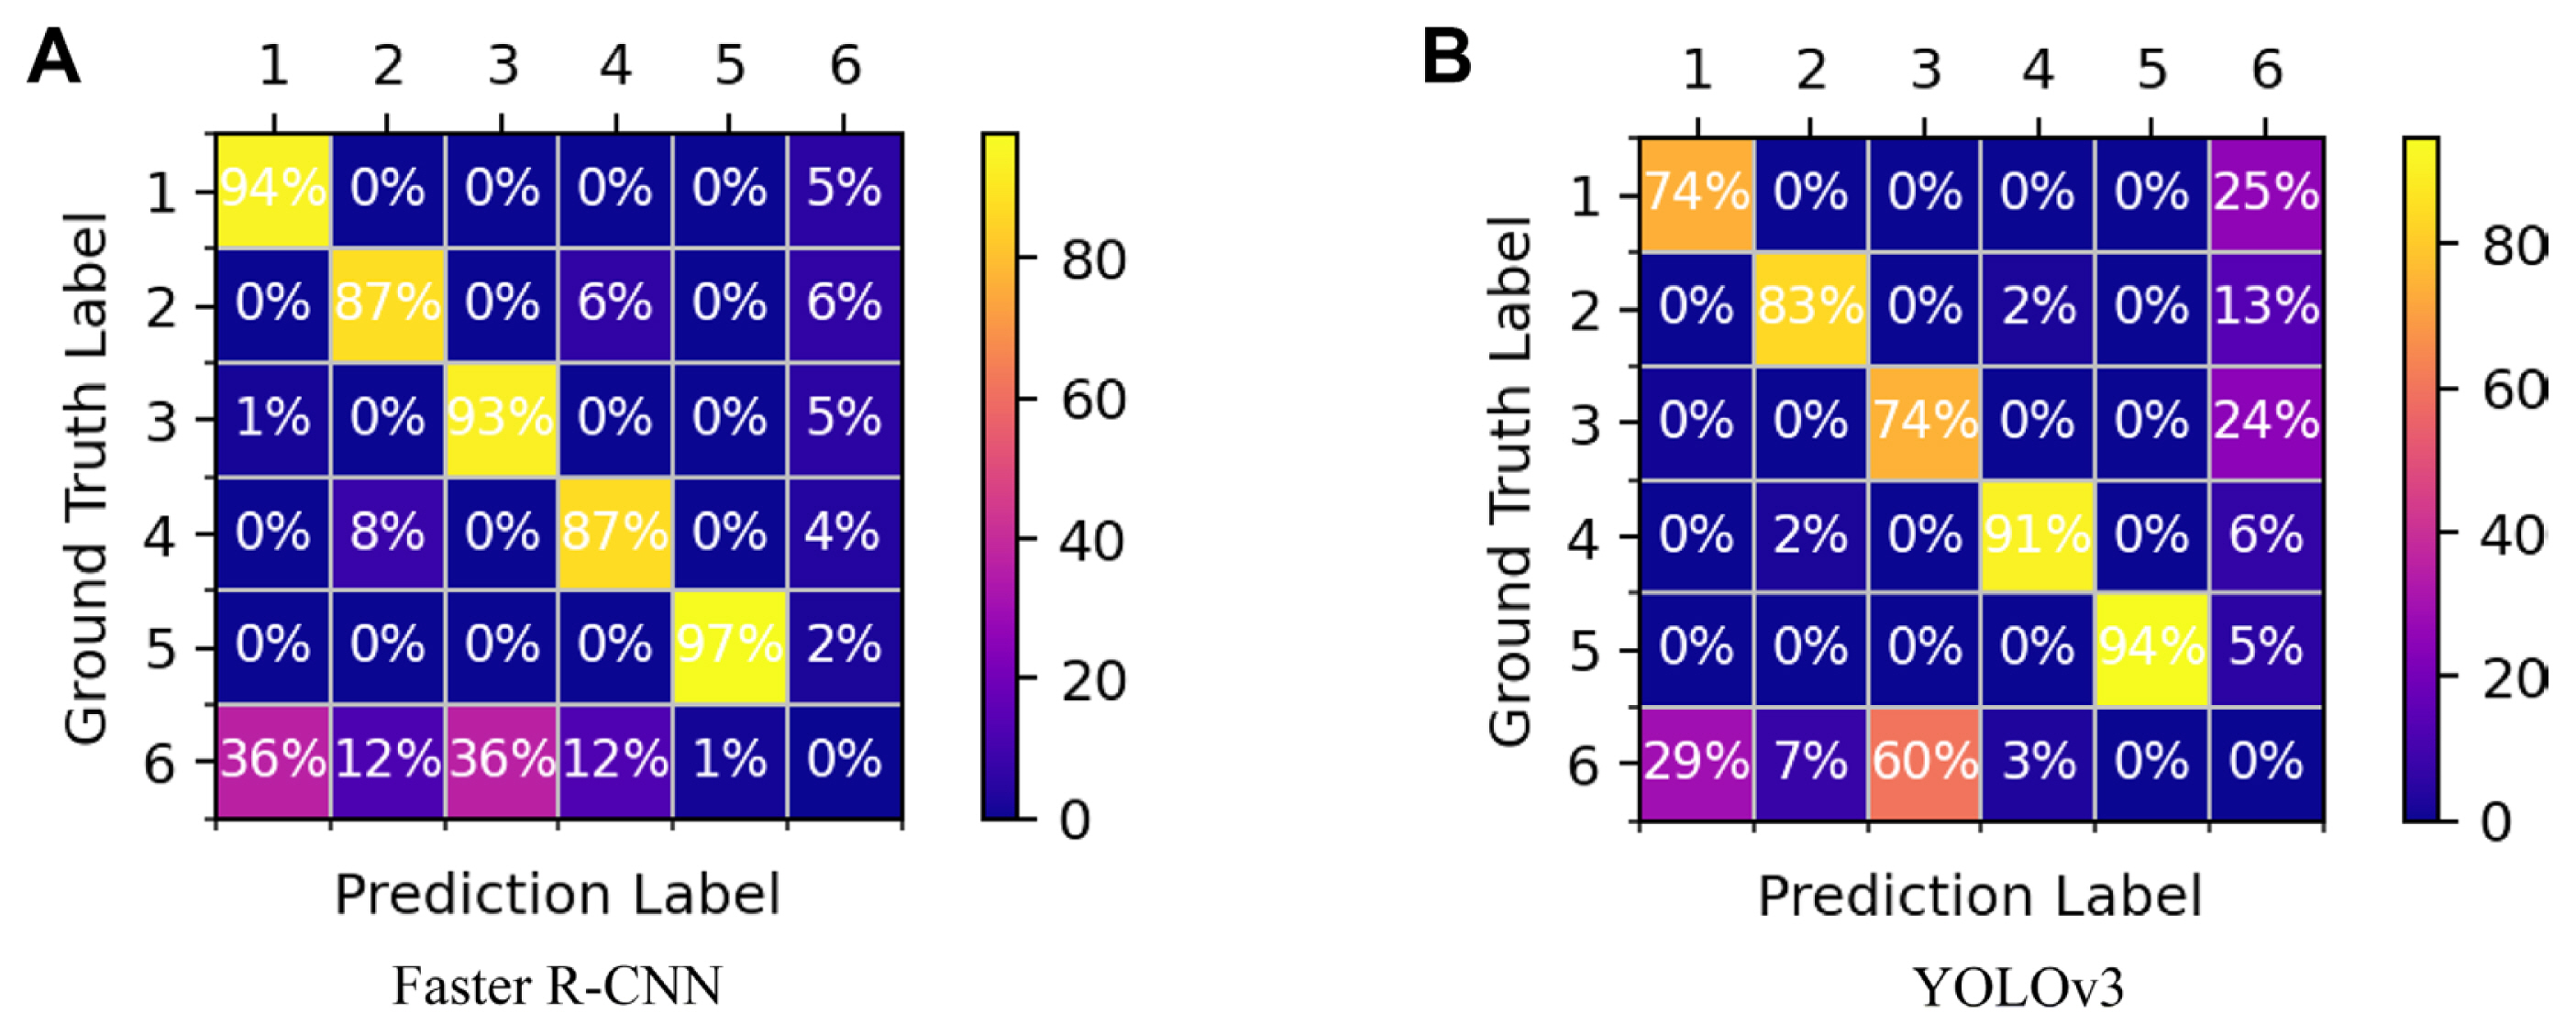
To visually evaluate the classification accuracy of the two models, confusion matrixes on the test dataset are provided in Fig. 8. In this particular two-dimensional matrix, the columns represent the predicted labels; the rows represent the ground truth labels. The values on the diagonal lines represent the proportion of correct predictions; the non-diagonal elements are the fraction of incorrect predictions. The classification accuracy of frogeye leaf spot, powdery mildew, and rust in Faster R-CNN is higher than that of YOLOv3. It happened to coincide with the experiment results in 3.2. According to the confusion matrix, the detection is more prone to confusion in distinguishing powdery mildew and scab. Besides, there is also confusion in identifying frogeye leaf spot and rust in Faster R-CNN model. This is due to the similarity in geometric features between the two diseases. Nevertheless, other classes are well differentiated. We can also find that YOLOv3 has a higher missed detection rate than Faster R-CNN. What’s more, the proportion of identifying the background as a disease is high, this is due to the fact that some diseases are not labeled but are identified, and of course, some diseases are misidentified. The confusion matrix provides an explanation for the different accuracy of disease identification in the experiment.

Feature visualization

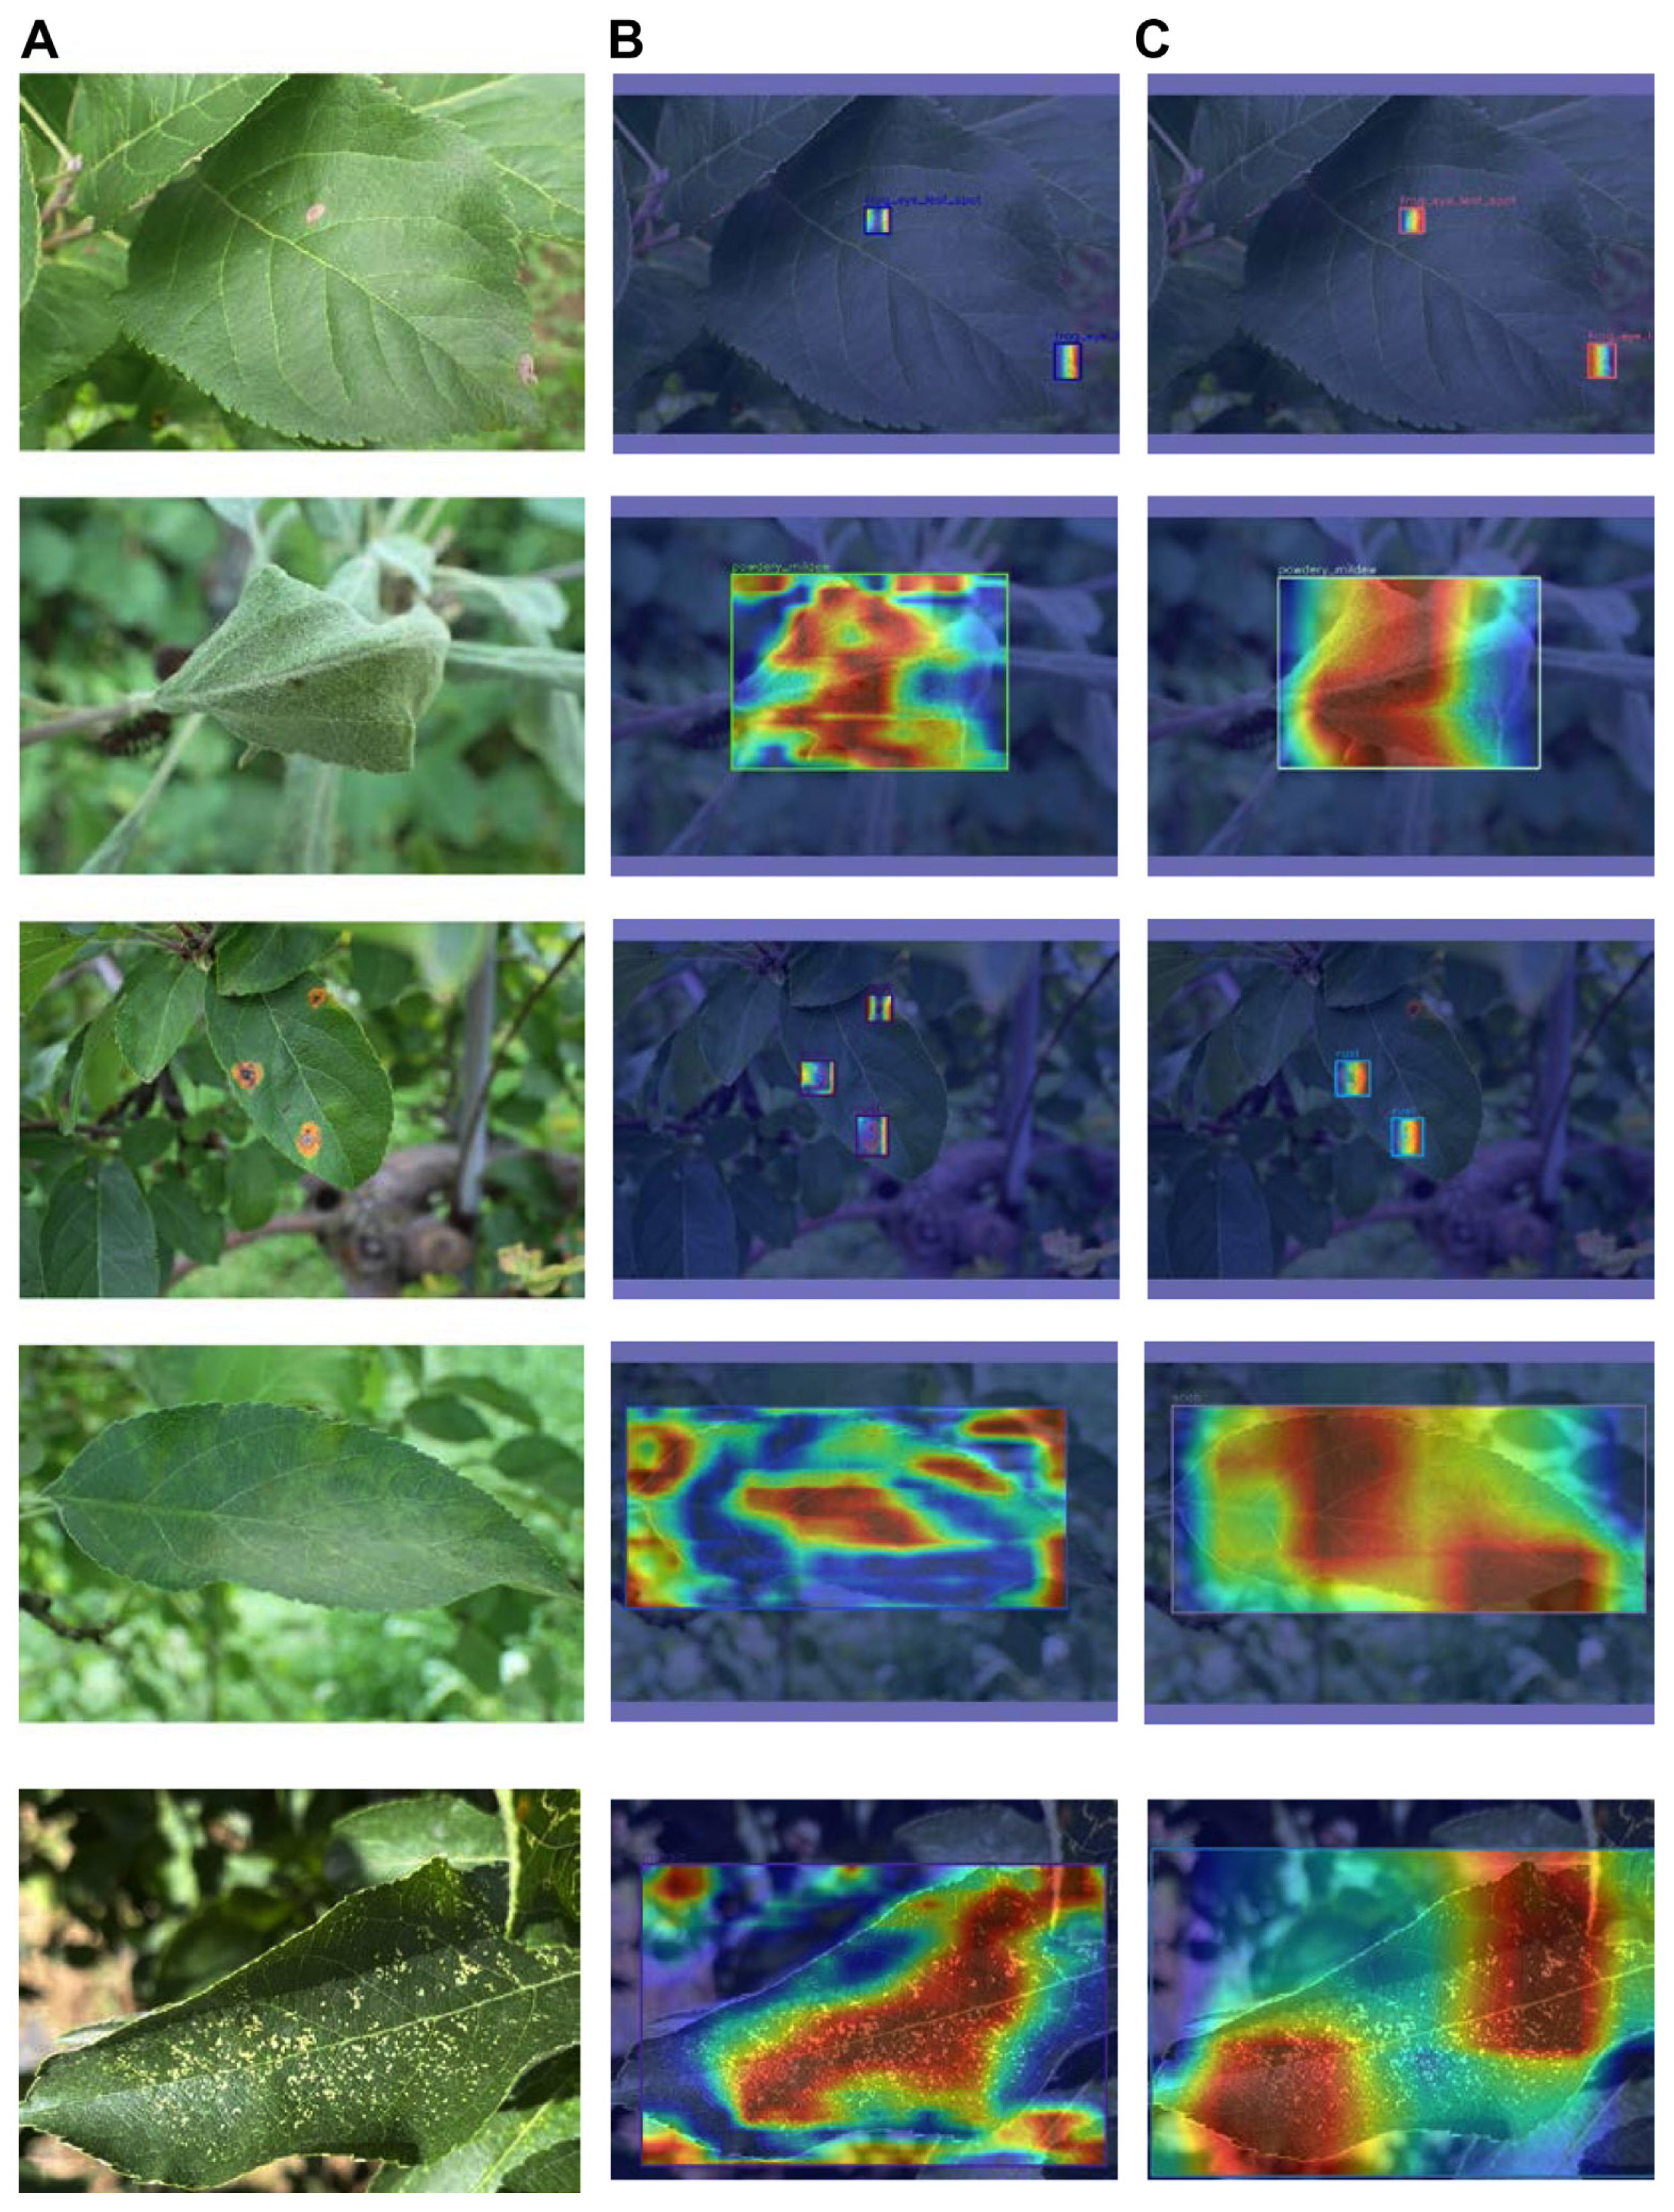
To explain the black-box properties of deep learning, the gradient-weighted class activation mapping method was used to explain the classification properties from a visualization point of view. Through Fig. 9, we can visually understand the differences in the feature maps extracted from different apple leaf diseases. First, the two models can clearly separate the disease lesions from the background. Besides, the classification features selected by YOLOv3 are smoother and more focused, and Fast R-CNN is more accurate in locating small target disease features. Moreover, the lesion of powdery mildew, scab, and mosaic have significant differences from other diseases and diffuses throughout the whole leaves, whereas frogeye leaf spot and rust are small and similar. But they still have slight differences. Frogeye leaf spot is rounder and rust is darker. The experiment illustrates the power of different models for classification, and the neural network can be optimized based on the visualization results.

Detection speed analysis

For the application of object detection in real life, the detection speed is also an important metric to consider besides detection accuracy. Generally speaking, the speed evaluation index in object detection is frame per second (FPS), that is, the number of pictures that the detector can process per second. We have evaluated the detection speed of Faster R-CNN and YOLOv3 and detailed results are listed in Table 7. As can be seen from Table 7, YOLOv3 has a 3.6% lower AP50 than Faster R-CNN, but 1% higher AR10 than Faster R-CNN. However, the FPS of YOLOv3 is 69.0, which is nearly 5 times higher than that of Faster R-CNN. That is, despite the detection accuracy, the running speed of Faster R-CNN is slow and not suitable for real-time detection. However, YOLOv3 is capable of real-time detection with a high detection speed of 69.0 FPS.
To comprehensively compare the two models, the total number of parameters trained in the model and floating-point operations (FLOPs) are calculated in Table 7. It is obvious that the FLOPs of Faster R-CNN decreased from 71.75G to 61.55G when compared to the case of YOLOv3, which means that YOLOv3 can process more images at the same time. Moreover, the parameters of YOLOv3 reach 61.55M, which increases 20.41M compared with Faster R-CNN. Therefore, the number of parameters does not directly affect the model inference performance but affects the memory consumption. On the other hand, due to the limitation of storage space and computing resources, it is still a huge challenge to store and compute neural network models on mobile devices and embedded devices. How to reduce the number of model parameters and complexity while maintaining the model accuracy is the current research hotspot for object detection.

Detection visualization

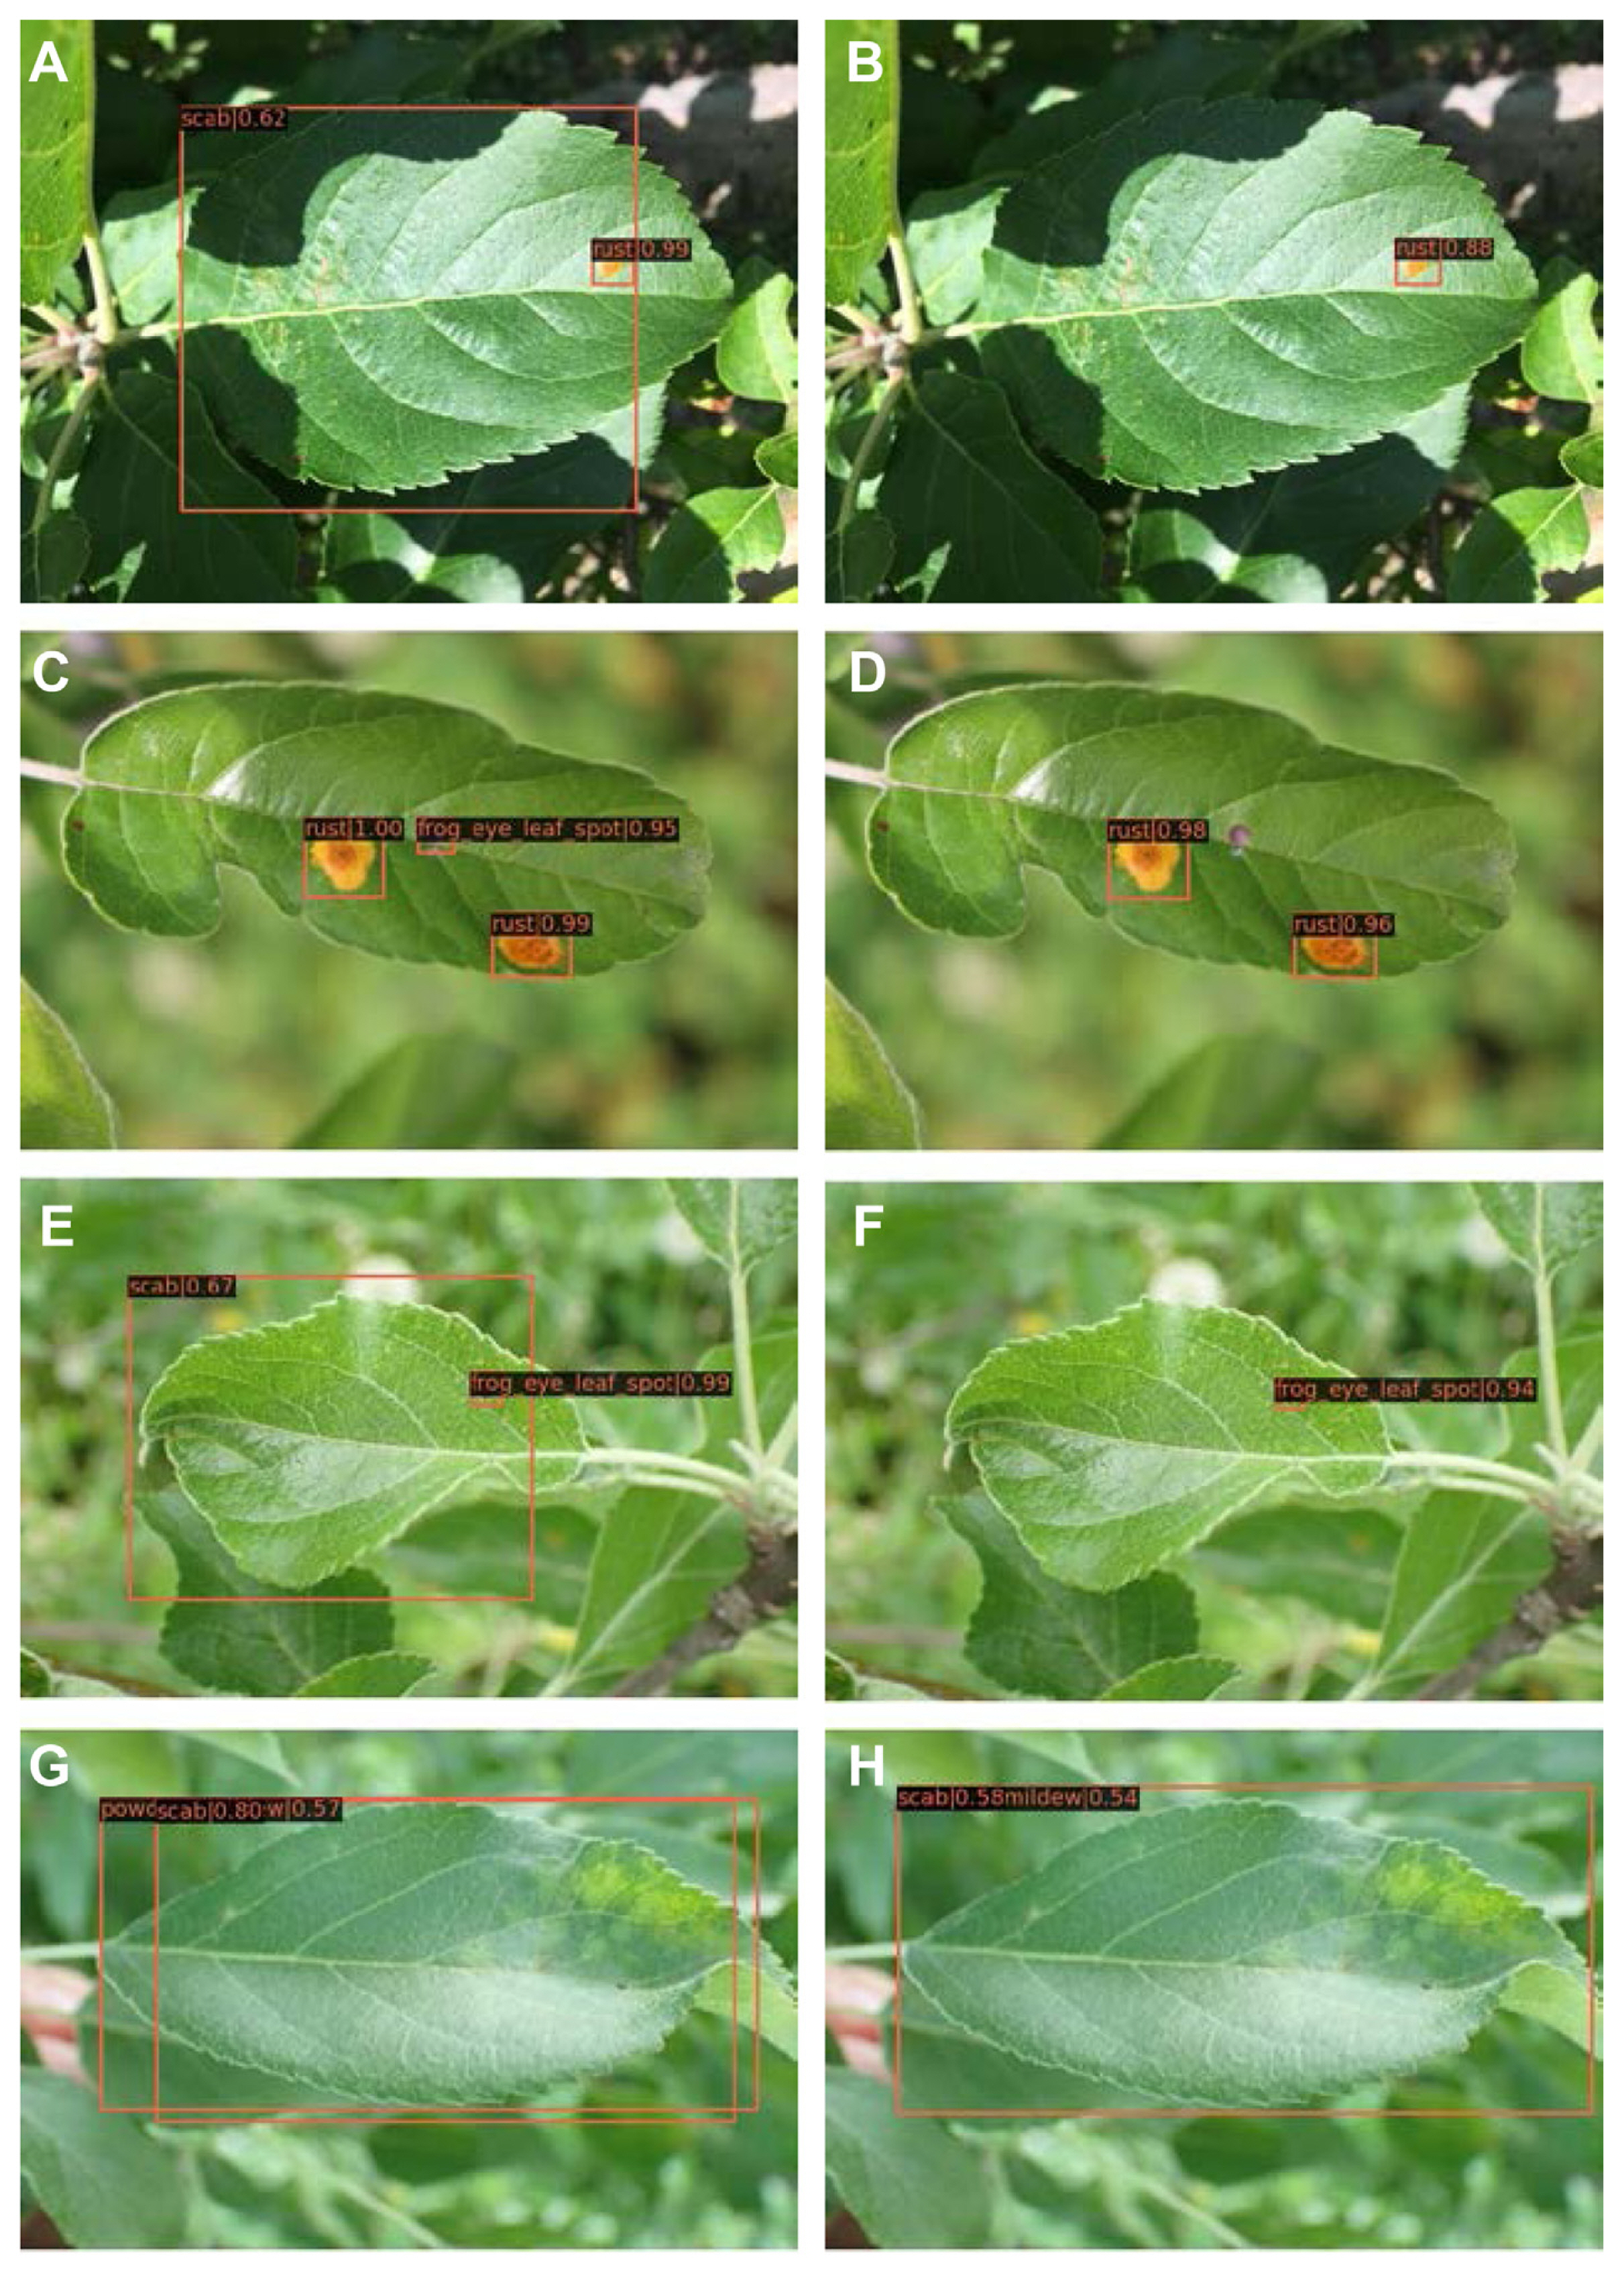
Faster R-CNN and YOLOv3 can detect most diseases on apple leaves, no matter if there are one or more diseases. We compared the results of the two methods for the same apple leaf, as shown in Fig. 10. In Fig. 10A, two diseases rust and scab were detected using Faster R-CNN, but only one disease rust was detected using YOLOv3, as presented in Fig. 10B. Similarly, the same is true in Fig. 10C and D. Faster R-CNN detected both rust and frogeye leaf spot, but YOLOv3 only detected rust. This demonstrates that YOLOv3 has a larger missed detection rate than Faster R-CNN, which is consistent with the results in the confusion matrix. However, the scab false detection rate in Faster R-CNN is also high, for example, Fig. 10E is the result of the incorrect detection of a healthy leaf as a scab maybe due to bright light, and Fig. 10F is the correct detection result of YOLOv3. Fig. 10G and H display erroneous identifications of powdery mildew and scab for the two models. According to the confusion matrix, these two diseases are easily confused which leads to low recognition accuracy for both of them. The reason is that the two diseases are similar in appearance.

Discussion

In this paper, we analyze the common methods of plant disease detection, among which the object detection technique represented by the CNN can achieve automatic and efficient detection of diseases. The principle and process of the two-stage object detection representative algorithm Faster R-CNN and one-stage object detection representative algorithm YOLOv3 are mainly introduced. The constructed datasets containing five apple leaf diseases were chosen as the research data, on which the experiments were conducted by using the above object detection methods. The experimental results show that both models can detect the five apple leaf diseases with high recognition accuracy. In addition, the AP of Faster R-CNN is smaller than that of YOLOv3, and the AP of Faster R-CNN is larger than that of YOLOv3 when IoU is 0.75, indicating that Faster R-CNN labels target more accurately than YOLOv3. Interestingly, although the detection accuracy of YOLOv3 is slightly lower, the detection speed is faster at 69.0 FPS, whereas that of Faster R-CNN is only 13.9 FPS. That is, YOLOv3 has advantages in detection speed, but the two-stage target detection model Faster R-CNN has high detection accuracy. The work provides a foundation for intelligent recognition and engineering applications in automatic plant disease detection.
The aim of the work is to investigate the feasibility of identifying apple leaf disease from images taken under realistic growth conditions based on deep learning methods. For images used in some previous studies, the complex background information has been removed (Pradhan et al., 2022) or the background information has not been presented (Pradhan et al., 2022). This seems to obtain high accuracy, but is limited in practical application. Although some studies have reported the images of apple leaf diseases under natural conditions, the limited number of diseases using only two (Sardoğan et al., 2020) or three (Wang et al., 2022) can’t meet the requirements of the diversity of apple leaf disease in the real environment. Besides, the compared experimental results conclude that both models have good disease identification performance. Particularly, Faster R-CNN has high detection accuracy, whereas YOLOv3 has a fast detection speed. Faster R-CNN and YOLOv3 algorithms are generally improved according to the actual requirements. The improved Faster R-CNN tends to improve detection accuracy (Alruwaili et al., 2022; Nawaz et al., 2022), and the improved YOLOv3 algorithm emphasizes the improvement of detection speed (Liu and Wang, 2020; Tian et al., 2019). Hence, balancing and optimizing detection accuracy and detection speed plays a major role in plant disease identification. Furthermore, it is difficult to detect small targets due to few pixels in the image and insufficient information. In our work, Faster R-CNN has higher detection accuracy for small diseases, and YOLOv3 has higher detection accuracy for large diseases. Since the lesion size is small in the early stage, indicating that Faster R-CNN is more suitable for detecting initial small target diseases. Hou et al. (2023) used improved Faster R-CNN to detect small disease spots. It is significant to identify small diseases with high precision in the future. Plant diseases are the main factors affecting crop yield reduction. Timely and accurately identifying crop disease at the early stage is very important for farmers. However, the loss of agricultural technicians at the grassroots makes farmers unable to accurately judge the types of crop diseases, resulting in yield reduction and economic losses. Therefore, it is of great practical significance to develop an efficient and low-cost crop disease identification method to rapidly and accurately identify crop disease types. Computer technology has achieved good results in plant pathology research and made vast contributions to automatic crop disease detection. The deep learning network represented by CNN has a wide range of applications in plant disease identification. We will further devote to deploying models on portable devices to widely monitor and identify crop disease information.

Notes

Conflicts of Interest

No potential conflict of interest relevant to this article was reported.

Acknowledgments

This study was supported by the National Natural Science Foundation of China (No. 12202253), the Youth Science and Technology Innovation Project of Shanxi Agricultural University Grant (No. 2019019) and the Shanxi Provincial Key Research and Development Project (No. 201903D221027).

Fig. 1
Sample images of different apple leaf diseases: (A) frogeye leaf spot, (B) scab, (C) rust, (D) powdery mildew, (E) mosaic, (F) frogeye leaf spot and rust, and (G) frogeye leaf spot and scab.
ppj-oa-02-2023-0034f1.jpg
Fig. 2
The example of infected frogeye leaf spot apple leaf annotation. (A) The annotated image, (B) The XML document.
ppj-oa-02-2023-0034f2.jpg
Fig. 3
Sample diagram of data preprocessing: (A) original image, (B) horizontal flip, (C) vertical flip, (D) random rotate, (E) random brightness contrast, (F) shift and rotate, (G) blur, (H) cutout, (I) gauss noise, and (J) hue saturation value transform.
ppj-oa-02-2023-0034f3.jpg
Fig. 4
Faster R-CNN architecture. Faster R-CNN extracts features from the input image to obtain feature maps, then feeds the feature map into the region proposal network to generate candidate boxes. Next, the original feature map and candidate boxes are input into the regions of interest Pooling layer, and the proposals are collected. Finally, the result is obtained through the Fast R-CNN network. R-CNN, regions with CNN features; RPN, region proposal network.
ppj-oa-02-2023-0034f4.jpg
Fig. 5
Darknet-53 network structure. Successive 3 × 3 and 1 × 1 convolutional layers, i.e., a total of 53 convolutional layers and shortcut connections are used to construct the network.
ppj-oa-02-2023-0034f5.jpg
Fig. 6
Bounding boxes with dimension priors and location prediction. The width and height of the box are predicted as offsets from cluster centroids.
ppj-oa-02-2023-0034f6.jpg
Fig. 7
The three different scales output of YOLOv3. YOLO, You Only Look Once.
ppj-oa-02-2023-0034f7.jpg
Fig. 8
The confusion matrix of the two models: (A) Faster R-CNN and (B) YOLOv3. 1-6 in the confusion matrix represents frogeye leaf spot, powdery mildew, rust, scab, mosaic, and background. R-CNN, regions with CNN features; YOLO, You Only Look Once.
ppj-oa-02-2023-0034f8.jpg
Fig. 9
Visualization results. (A) The original images (from top to bottom are frogeye leaf spot, powdery mildew, rust, scab, and mosaic). (B) The visualization results of the images in (A) by Faster R-CNN. (C) The visualization results of the images in (A) by YOLOv3. R-CNN, regions with CNN features; YOLO, You Only Look Once.
ppj-oa-02-2023-0034f9.jpg
Fig. 10
The detection results of the two models. (A, C, E, G) The detection results of Faster R-CNN. (B, D, F, H) The detection results of YOLOv3. The row shows the detection results of the two methods on the apple leaves. R-CNN, regions with CNN features; YOLO, You Only Look Once.
ppj-oa-02-2023-0034f10.jpg
Table 1
The number of each disease type
Disease No. of images Training set Validation set Test set
Frogeye leaf spot 400 321 40 39
Scab 400 321 40 39
Rust 400 321 40 39
Powdery mildew 400 321 40 39
Mosaic 378 303 38 37
Scab and frogeye leaf spot 54 44 5 5
Rust and frogeye leaf spot 52 42 5 5
Total 2,084 1,673 208 203
Table 2
Model parameter settings in different models
Configure item Faster R-CNN YOLOv3
Batch size 2 8
Learning rate 0.0025 0.001
Epoch 12 273
Momentum 0.9 0.9
Weight decay 0.0001 0.0005
Image scale 1,333 × 800 320 × 320

R-CNN, regions with CNN features; YOLO, You Only Look Once.

Table 3
Average precision (AP) performance comparison of different models
Model AP AP50 AP75 APS APM APL
Faster R-CNN 56.8 92.4 62.1 44.2 54.2 66.8
YOLOv3 57.2 88.8 60.5 36.7 48.2 70.9

R-CNN, regions with CNN features; YOLO, You Only Look Once.

Table 4
Average recall (AR) performance comparison of different models
Model ARdet 1 ARdet 10 ARdet 100 ARS ARM ARL
Faster R-CNN 49.3 64.0 65.1 53.8 62.6 72.7
YOLOv3 51.8 65.0 66.4 49.5 59.2 76.3

R-CNN, regions with CNN features; YOLO, You Only Look Once.

Table 5
AP50 of all classes of apple disease with different models
Model Frogeye leaf spot Powdery mildew Rust Scab Mosaic
Faster R-CNN 93.6 91.1 87.8 90.9 98.6
YOLOv3 84.0 87.1 81.0 92.9 99.0

AP50, average precision at Intersection of Union threshold 0.5; R-CNN, regions with CNN features; YOLO, You Only Look Once.

Table 6
The ratio of the disease target width and height to the original image width and height
Item Frogeye leaf spot Powdery mildew Rust Scab Mosaic
R-W 0.04 0.58 0.05 0.80 0.66
R-H 0.07 0.58 0.08 0.72 0.63

R-W and R-H stand for the ratio of the disease target width and height to the original image width and height, respectively.

Table 7
Comparison results of Faster R-CNN and YOLOv3 in terms of average precision (AP), average recall (AR), parameters, floating-point operations (FLOPs), and frame per second (FPS)
Methods Backbone AP50 ARdet 10 FPS FLOPs (G) Parameters (M)
Faster R-CNN ResNet-50 92.4 64.0 13.9 71.75 41.14
YOLOv3 DarNet-53 88.8 65.0 69.0 61.55 61.55

R-CNN, regions with CNN features; YOLO, You Only Look Once.

References

AI Studio. 2019. Pathological image of apple leaf URL https://aistudio.baidu.com/aistudio/datasetdetail/11591. 26 April 2023.
Alemu, K. 2014. Real-time PCR and its application in plant disease diagnostics. Adv. Life Sci. Technol 27:39-49.
Alruwaili, M., Siddiqi, M. H., Khan, A., Azad, M., Khan, A. and Alanazi, S. 2022. RTF-RCNN: an architecture for real-time tomato plant leaf diseases detection in video streaming using Faster-RCNN. Bioengineering 9:565.
crossref pmid pmc
Bhat, I. A., Bhat, R. A., Shrivastava, M. and Sharma, D. M. 2018. In: Universal dependency parsing for Hindi-English code-switching, In: Proceedings of the 2018 Conference of the North American Chapter of the Association for Computational Linguistics: Human Language Technologies; 1:eds. by In : M. Walkter, H. Ji and A. Stent, pp. 987-998. Association for Computational Linguistics, New Orleans, LA, USA.
Bhujel, A., Kim, N.-E., Arulmozhi, E., Basak, J. K. and Kim, H.-T. 2022. A lightweight attention-based convolutional neural networks for tomato leaf disease classification. Agriculture 12:228.
crossref
Caldeira, R. F., Santiago, W. E. and Teruel, B. 2021. Identification of cotton leaf lesions using deep learning techniques. Sensors (Basel) 21:3169.
crossref pmid pmc
Chang, Y. K., Zaman, Q. U., Schumann, A. W., Percival, D. C., Esau, T. J. and Ayalew, G. 2012. Development of color co-occurrence matrix based machine vision algorithms for wild blueberry fields. Appl. Eng. Agric 28:315-323.
crossref
Chen, K., Wang, J., Pang, J., Cao, Y., Xiong, Y., Li, X., Sun, S., Feng, W., Liu, Z., Xu, J., Zhang, Z., Cheng, D., Zhu, C., Cheng, T., Zhao, Q., Li, B., Lu, X., Zhu, R., Wu, Y., Dai, J., Wang, J., Shi, J., Ouyang, W., Loy, C. C. and Lin, D. 2019 MMDetection: open MMLab detection toolbox and benchmark Preprint at https://doi.org/10.48550/arXiv.1906.07155.
Cynthia, S. T., Hossain, K. M. S., Hasan, M. N., Asaduzzaman, M. and Das, A. K. 2019. Automated detection of plant diseases using image processing and Faster R-CNN algorithm. In: 2019 International Conference on Sustainable Technologies for Industry 4.0 (STI); pp 1-5. Institute of Electrical and Electronics Engineers, Piscataway, NJ, USA.
crossref
Dai, J., Li, Y., He, K. and Sun, J. 2016. R-FCN: object detection via region-based fully convolutional networks. In: Proceedings of the 30th International Conference on Neural Information Processing Systems, eds. by D. D. Lee, M. Sugiyama, U. Luxburg, I. Guyon and R. Garnett, pp. 379-387. Curran Associates Inc, Red Hook, NY, USA.
Deng, R., Tao, M., Xing, H., Yang, X., Liu, C., Liao, K. and Qi, L. 2021. Automatic diagnosis of rice diseases using deep learning. Front. Plant Sci 12:701038.
crossref pmid pmc
Dubey, S. R. and Jalal, A. S. 2012. Detection and classification of apple fruit diseases using complete local binary patterns. In: 2012 Third International Conference on Computer and Communication Technology; pp 346-351. IEEE Computer Society, Washington, DC, USA.
crossref
Fernández-Campos, M., Huang, Y. T., Jahanshahi, M. R., Wang, T., Jin, J., Telenko, D. E. P., Góngora-Canul, C. and Cruz, C. D. 2021. Wheat spike blast image classification using deep convolutional neural networks. Front. Plant Sci 12:673505.
crossref pmid pmc
Food and Agriculture Organization of the United Nations 2021 Climate change fans spread of pests and threatens plants and crops, new FAO study URL https://www.fao.org/newsroom/detail/Climate-change-fans-spread-of-pests-and-threatens-plants-and-crops-new-FAO-study/zh. 26 April 2023.
Girshick, R. 2015. Fast R-CNN. In: Proceedings of the 2015 IEEE International Conference on Computer Vision (ICCV); pp 1440-1448. IEEE Computer Society, Washington, DC, USA.
crossref
Girshick, R., Donahue, J., Darrell, T. and Malik, J. 2014. Rich feature hierarchies for accurate object detection and semantic segmentation. In: Proceedings of the 2014 IEEE Conference on Computer Vision and Pattern Recognition (CVPR); pp 580-587. IEEE Computer Society, Washington, DC, USA.
crossref
He, K., Gkioxari, G., Dollár, P. and Girshick, R. 2017. Mask R-CNN. In: Proceedings of the 2017 IEEE International Conference on Computer Vision (ICCV); pp 2980-2988. IEEE Computer Society, Washington, DC, USA.
crossref
He, K., Zhang, X., Ren, S. and Sun, J. 2015. Spatial pyramid pooling in deep convolutional networks for visual recognition. IEEE Trans. Pattern Anal. Mach. Intell 37:1904-1916.
crossref pmid
He, K., Zhang, X., Ren, S. and Sun, J. 2016. Deep residual learning for image recognition. In: Proceedings of the 2016 IEEE Conference on Computer Vision and Pattern Recognition (CVPR); pp 770-778. IEEE Computer Society, Washington, DC, USA.
crossref
Hlaing, C. S. and Maung Zaw, S. M. 2018. Tomato plant diseases classification using statistical texture feature and color feature. In: Proceedings of the 2018 IEEE/ACIS 17th International Conference on Computer and Information Science (ICIS); pp 439-444. IEEE Computer Society, Los Alamitos, CA, USA.
crossref
Hou, J., Yang, C., He, Y. and Hou, B. 2023. Detecting diseases in apple tree leaves using FPN-ISResNet-Faster RCNN. Eur. J. Remote Sens 56:2186955.
crossref
Jia, Y., Zhang, Q., Zhang, W. and Wang, X. 2019. In: CommunityGAN: community detection with generative adversarial nets, In: The Web Conference 2019; eds. by In : L. Liu and R. White, pp. 784-794. Association for Computing Machinery, New York, NY, USA.
Jos, J. and Venkatesh, K. A. 2020. Pseudo color region features for plant disease detection. In: 2020 IEEE International Conference for Innovation in Technology (INOCON 2020); pp 1-5. Institute of Electrical and Electronics Engineers, Piscataway, NJ, USA.
crossref
Karadağ, K., Tenekeci, M. E., Taşaltın, R. and Bilgili, A. 2020. Detection of pepper fusarium disease using machine learning algorithms based on spectral reflectance. Sustain. Comput. Inform. Syst 28:100299.
crossref
Krizhevsky, A., Sutskever, I. and Hinton, G. E. 2012. ImageNet classification with deep convolutional neural networks. Adv. Neural Inf. Process Syst 25:1097-1105.
crossref
Li, J.-H., Lin, L.-J. and Tian, K. 2020a. Detection of leaf diseases of balsam pear in the field based on improved Faster R-CNN. Trans. Chin. Soc. Agric. Eng 36:179-185 (in Chinese).
Li, Z., Guo, R., Li, M., Chen, Y. and Li, G. 2020b. A review of computer vision technologies for plant phenotyping. Comput. Electron. Agric 176:105672.
crossref
Lin, T.-Y., Dollár, P., Girshick, R., He, K., Hariharan, B. and Belongie, S. 2017. Feature pyramid networks for object detection. In: 2017 IEEE Conference on Computer Vision and Pattern Recognition (CVPR); pp 936-944. Institute of Electrical and Electronics Engineers, Piscataway, NJ, USA.
crossref
Liu, J. and Wang, X. 2020. Tomato diseases and pests detection based on improved Yolo V3 convolutional neural network. Front. Plant Sci 11:898.
crossref pmid pmc
Liu, W., Anguelov, D., Erhan, D., Szegedy, C., Reed, S., Fu, C.-Y. and Berg, A. C. 2016. SSD: single shot MultiBox detector. In: Computer Vision - ECCV 2016, eds. by B. Leibe, J. Matas, N. Sebe and M. Welling, pp. 21-37. Springer, Cham, Switzerland.
crossref
Mathew, M. P. and Mahesh, T. Y. 2022. Leaf-based disease detection in bell pepper plant using YOLO v5. Signal Image Video Process 16:841-847.
crossref pdf
Nandhini, N. and Bhavani, R. 2020. Feature extraction for diseased leaf image classification using machine learning. In: 2020 International Conference on Computer Communication and Informatics (ICCCI); pp 1-4. Institute of Electrical and Electronics Engineers, Piscataway, NJ, USA.
crossref
Nawaz, M., Nazir, T., Javed, A., Masood, M., Rashid, J., Kim, J. and Hussain, A. 2022. A robust deep learning approach for tomato plant leaf disease localization and classification. Sci. Rep 12:18568.
crossref pmid pmc pdf
Pradhan, P., Kumar, B. and Mohan, S. 2022. Comparison of various deep convolutional neural network models to discriminate apple leaf diseases using transfer learning. J. Plant Dis. Protec 129:1461-1473.
crossref pdf
Pushpa, B. R., Shree Hari, A. V. and Adarsh, A. 2021. In: Diseased leaf segmentation from complex background using indices based histogram, In: Computational Experimental Simulations in Engineering: Proceedings of ICCES 2020; 1:eds. by In : S. N. Atluri and I. Vušanović, pp. 1502-1507. Springer, Cham, Switzerland.
Redmon, J., Divvala, S. K., Girshick, R. B. and Farhadi, A. 2016. You only look once: unified, real-time object detection. In: 2016 IEEE Conference on Computer Vision and Pattern Recognition (CVPR); pp 779-788. IEEE Computer Society, Washington, DC, USA.
crossref
Redmon, J. and Farhadi, A. 2017. YOLO9000: better, faster, stronger. In: 2017 IEEE Conference on Computer Vision and Pattern Recognition (CVPR); pp 6517-6525. IEEE Computer Society, Washington, DC, USA.
crossref
Redmon, J. and Farhadi, A. 2018 YOLO V3: an incremental improvement Preprint at https://doi.org/10.48550/arXiv.1804.02767.
Ren, S., He, K., Girshick, R. and Sun, J. 2017. Faster R-CNN: towards real-time object detection with region proposal networks. IEEE Trans. Pattern Anal. Mach. Intell 39:1137-1149.
crossref pmid
Sardoğan, M., Özen, Y. and Tuncer, A. 2020. Detection of apple leaf diseases using Faster R-CNN. Düzce Univ. J. Sci. Technol 8:1110-1117.
crossref
Shrivastava, V. K. and Pradhan, M. K. 2021. Rice plant disease classification using color features: a machine learning paradigm. J. Plant Pathol 103:17-26.
crossref pdf
Simon, M., Milz, S., Amende, K. and Gross, H.-M. 2019. Complex-YOLO: an Euler-Region-Proposal for real-time 3D object detection on point clouds. In: Computer Vision - ECCV 2018, eds. by L. Leal-Taixé and S. Roth, pp. 197-209. Springer, Cham, Switzerland.
crossref
Simonyan, K. and Zisserman, A. 2015 Very deep convolutional networks for large-scale image recognition Preprint at https://arxiv.org/abs/1409.1556.
Srivastava, A., Jha, D., Chanda, S., Pal, U., Johansen, H. D., Johansen, D., Riegler, M. A., Ali, S. and Halvorsen, P. 2021. MSRF-Net: a multi-scale residual fusion network for biomedical image segmentation. IEEE J. Biomed. Health Inform 26:2252-2263.
crossref
Sterling, A. and Melgarejo, L. M. 2020. Leaf spectral reflectance of Hevea brasiliensis in response to Pseudocercospora ulei. Eur. J. Plant Pathol 156:1063-1076.
crossref pdf
Szegedy, C., Liu, W., Jia, Y., Sermanet, P., Reed, S., Anguelov, D., Erhan, D., Vanhoucke, V. and Rabinovich, A. 2015. Going deeper with convolutions. In: 2015 IEEE Conference on Computer Vision and Pattern Recognition (CVPR); pp 1-9. IEEE Computer Society, Washington, DC, USA.
crossref
Tamuli, P. 2020. The polymerase chain reaction (PCR) and plant disease diagnosis: a review. Plant Arch 20:3495-3498.
Taohidul Islam, S. M., Masud, M. A., Ur Rahaman, M. A. and Hasan Rabbi, M. M. 2019. Plant leaf disease detection using mean value of pixels and canny edge detector. In: 2019 International Conference on Sustainable Technologies for Industry 4.0 (STI); pp 1-6. Institute of Electrical and Electronics Engineers, Piscataway, NJ, USA.
crossref
Thapa, R., Zhang, K., Snavely, N., Belongie, S. and Khan, A. 2020. The Plant Pathology Challenge 2020 data set to classify foliar disease of apples. Appl. Plant Sci 8:e11390.
crossref pmid pmc pdf
Tian, Y., Yang, G., Wang, Z., Li, E. and Liang, Z. 2019. Detection of apple lesions in orchards based on deep learning methods of CycleGAN and YOLOV3-Dense. J. Sens 2019:7630926.
crossref pdf
Tugrul, B., Elfatimi, E. and Eryigit, R. 2022. Convolutional neural networks in detection of plant leaf diseases: a review. Agriculture 12:1192.
crossref
Waheed, A., Goyal, M., Gupta, D., Khanna, A., Hassanien, A. E. and Pandey, H. M. 2020. An optimized dense convolutional neural network model for disease recognition and classification in corn leaf. Comput. Electron. Agric 175:105456.
crossref
Wang, Q. and Qi, F. 2019. Tomato diseases recognition based on Faster RCNN. In: 2019 10th International Conference on Information Technology in MedicineEducation (ITME 2019); pp 772-776. Institute of Electrical and Electronics Engineers, Piscataway, NJ, USA.
crossref
Wang, X. and Liu, J. 2021. Tomato anomalies detection in greenhouse scenarios based on YOLO-Dense. Front. Plant Sci 12:634103.
crossref pmid pmc
Wang, Y., Wang, Y. and Zhao, J. 2022. MGA-YOLO: a lightweight one-stage network for apple leaf disease detection. Front. Plant Sci 13:927424.
crossref pmid pmc
Wani, J. A., Sharma, S., Muzamil, M., Ahmed, S., Sharma, S. and Singh, S. 2022. Machine learning and deep learning based computational techniques in automatic agricultural diseases detection: methodologies, applications, and challenges. Arch. Comput. Methods Eng 29:641-677.
crossref pdf
Yan, Q., Yang, B., Wang, W., Wang, B., Chen, P. and Zhang, J. 2020. Apple leaf diseases recognition based on an improved convolutional neural network. Sensors (Basel) 20:3535.
crossref pmid pmc
Zhang, K., Xu, Z., Dong, S., Cen, C. and Wu, Q. 2019. Identification of peach leaf disease infected by Xanthomonas campestris with deep learning. Eng. Agric. Environ. Food 12:388-396.
crossref
Zhang, Y., Qin, J., Park, D. S., Han, W., Chiu, C.-C., Pang, R., Le, Q. V. and Wu, Y. 2020 Pushing the limits of semi-supervised learning for automatic speech recognition Preprint at https://doi.org/10.48550/arXiv.2010.10504.
Zhou, C., Zhou, S., Xing, J. and Song, J. 2021. Tomato leaf disease identification by restructured deep residual dense network. IEEE Access 9:28822-28831.
crossref
TOOLS
METRICS Graph View
  • 6 Web of Science
  • 3 Crossref
  •  0 Scopus
  • 3,799 View
  • 164 Download
ORCID iDs

Shujuan Zhang
https://orcid.org/0000-0002-9671-7086

Related articles


ABOUT
BROWSE ARTICLES
EDITORIAL POLICY
FOR CONTRIBUTORS
Editorial Office
Rm,904 (New Bldg.) The Korean Science & Technology Center 22,
Teheran-ro 7-Gil, Gangnamgu, Seoul 06130, Korea
Tel: +82-2-557-9360    Fax: +82-2-557-9361    E-mail: paper@kspp.org                

Copyright © 2024 by Korean Society of Plant Pathology.

Developed in M2PI

Close layer
prev next