


Faba bean (Vicia faba L.) originates from the Near East and is one of the first domesticated legumes after chickpeas and peas (Caracuta et al., 2015). Ethiopia is the second-leading producer of faba beans, following China (FAOSTAT, 2016), and is considered one of the nine ideal geographical areas to cultivate faba beans (Keneni et al., 2005). Faba bean is utilized as a rotational crop in wheat- and barley-based cropping systems and contributes to soil fertility through nitrogen fixation (Agegnehu and Fessehaie, 2006). The total area sown to faba bean in 2020 was 504,570 ha, with a total production of 1,070,637 tons and productivity of 2.1 tons/ha (Central Statically Authority, 2020). The low productivity of the faba bean is mainly due to its susceptibility to numerous abiotic and biotic constraints (Jarso et al., 2008).
The faba bean gall (FBG) (Physoderma sp.) (You et al., 2021), Ascochyta blight (Ascochyta fabae), faba bean rust (Uromyces viciae-fabae), chocolate spot (Botrytis fabae) and faba bean necrotic yellows virus and black root rot (Fusarium solani) are the major faba bean diseases identified in Ethiopia (Gorfu and Beshir, 1994). Of these, FBG is considered the most serious threat to faba bean production (Hailu et al., 2014). The rapid spread of FBG from infested areas to uninfected areas in Ethiopia has led to the devastation of large areas of cultivated faba beans (Nigir et al., 2016). In some instances, there may be a total loss (Hailu et al., 2014) and in others yield losses of 50-62% have been reported on released commercially faba bean varieties and up to 54% on farmer/local varieties in Ethiopia (Bitew et al., 2022). Studies in China show FBG causes smaller yield losses there of about 20% (Lang et al., 1993; Yan, 2012).
Faba bean production practices are many and varied, including differences in weeding, fungicide application, cultural management, fertilizer application, and cropping systems. Along with agroecological and seasonal variability across years, they together influence FBG and other diseasesŌĆÖ occurrence, development, and level of subsequent crop damage. As such factors can have a role in the distribution and severity of FBG disease in Ethiopia (Bitew et al., 2021; Hailu et al., 2014), there is a need to identify associations of disease incidence (DI) and severity with diverse farm practices, and geographical and ecological variability to identify the most critical factor(s) offering the best opportunities for possible intervention to improve disease management. Toward this outcome, this study aimed to determine the geographical distribution, relative importance, incidence, and severity of FBG epidemics in Ethiopia, and their association with factors influencing those epidemics.
Materials and Methods
Study area
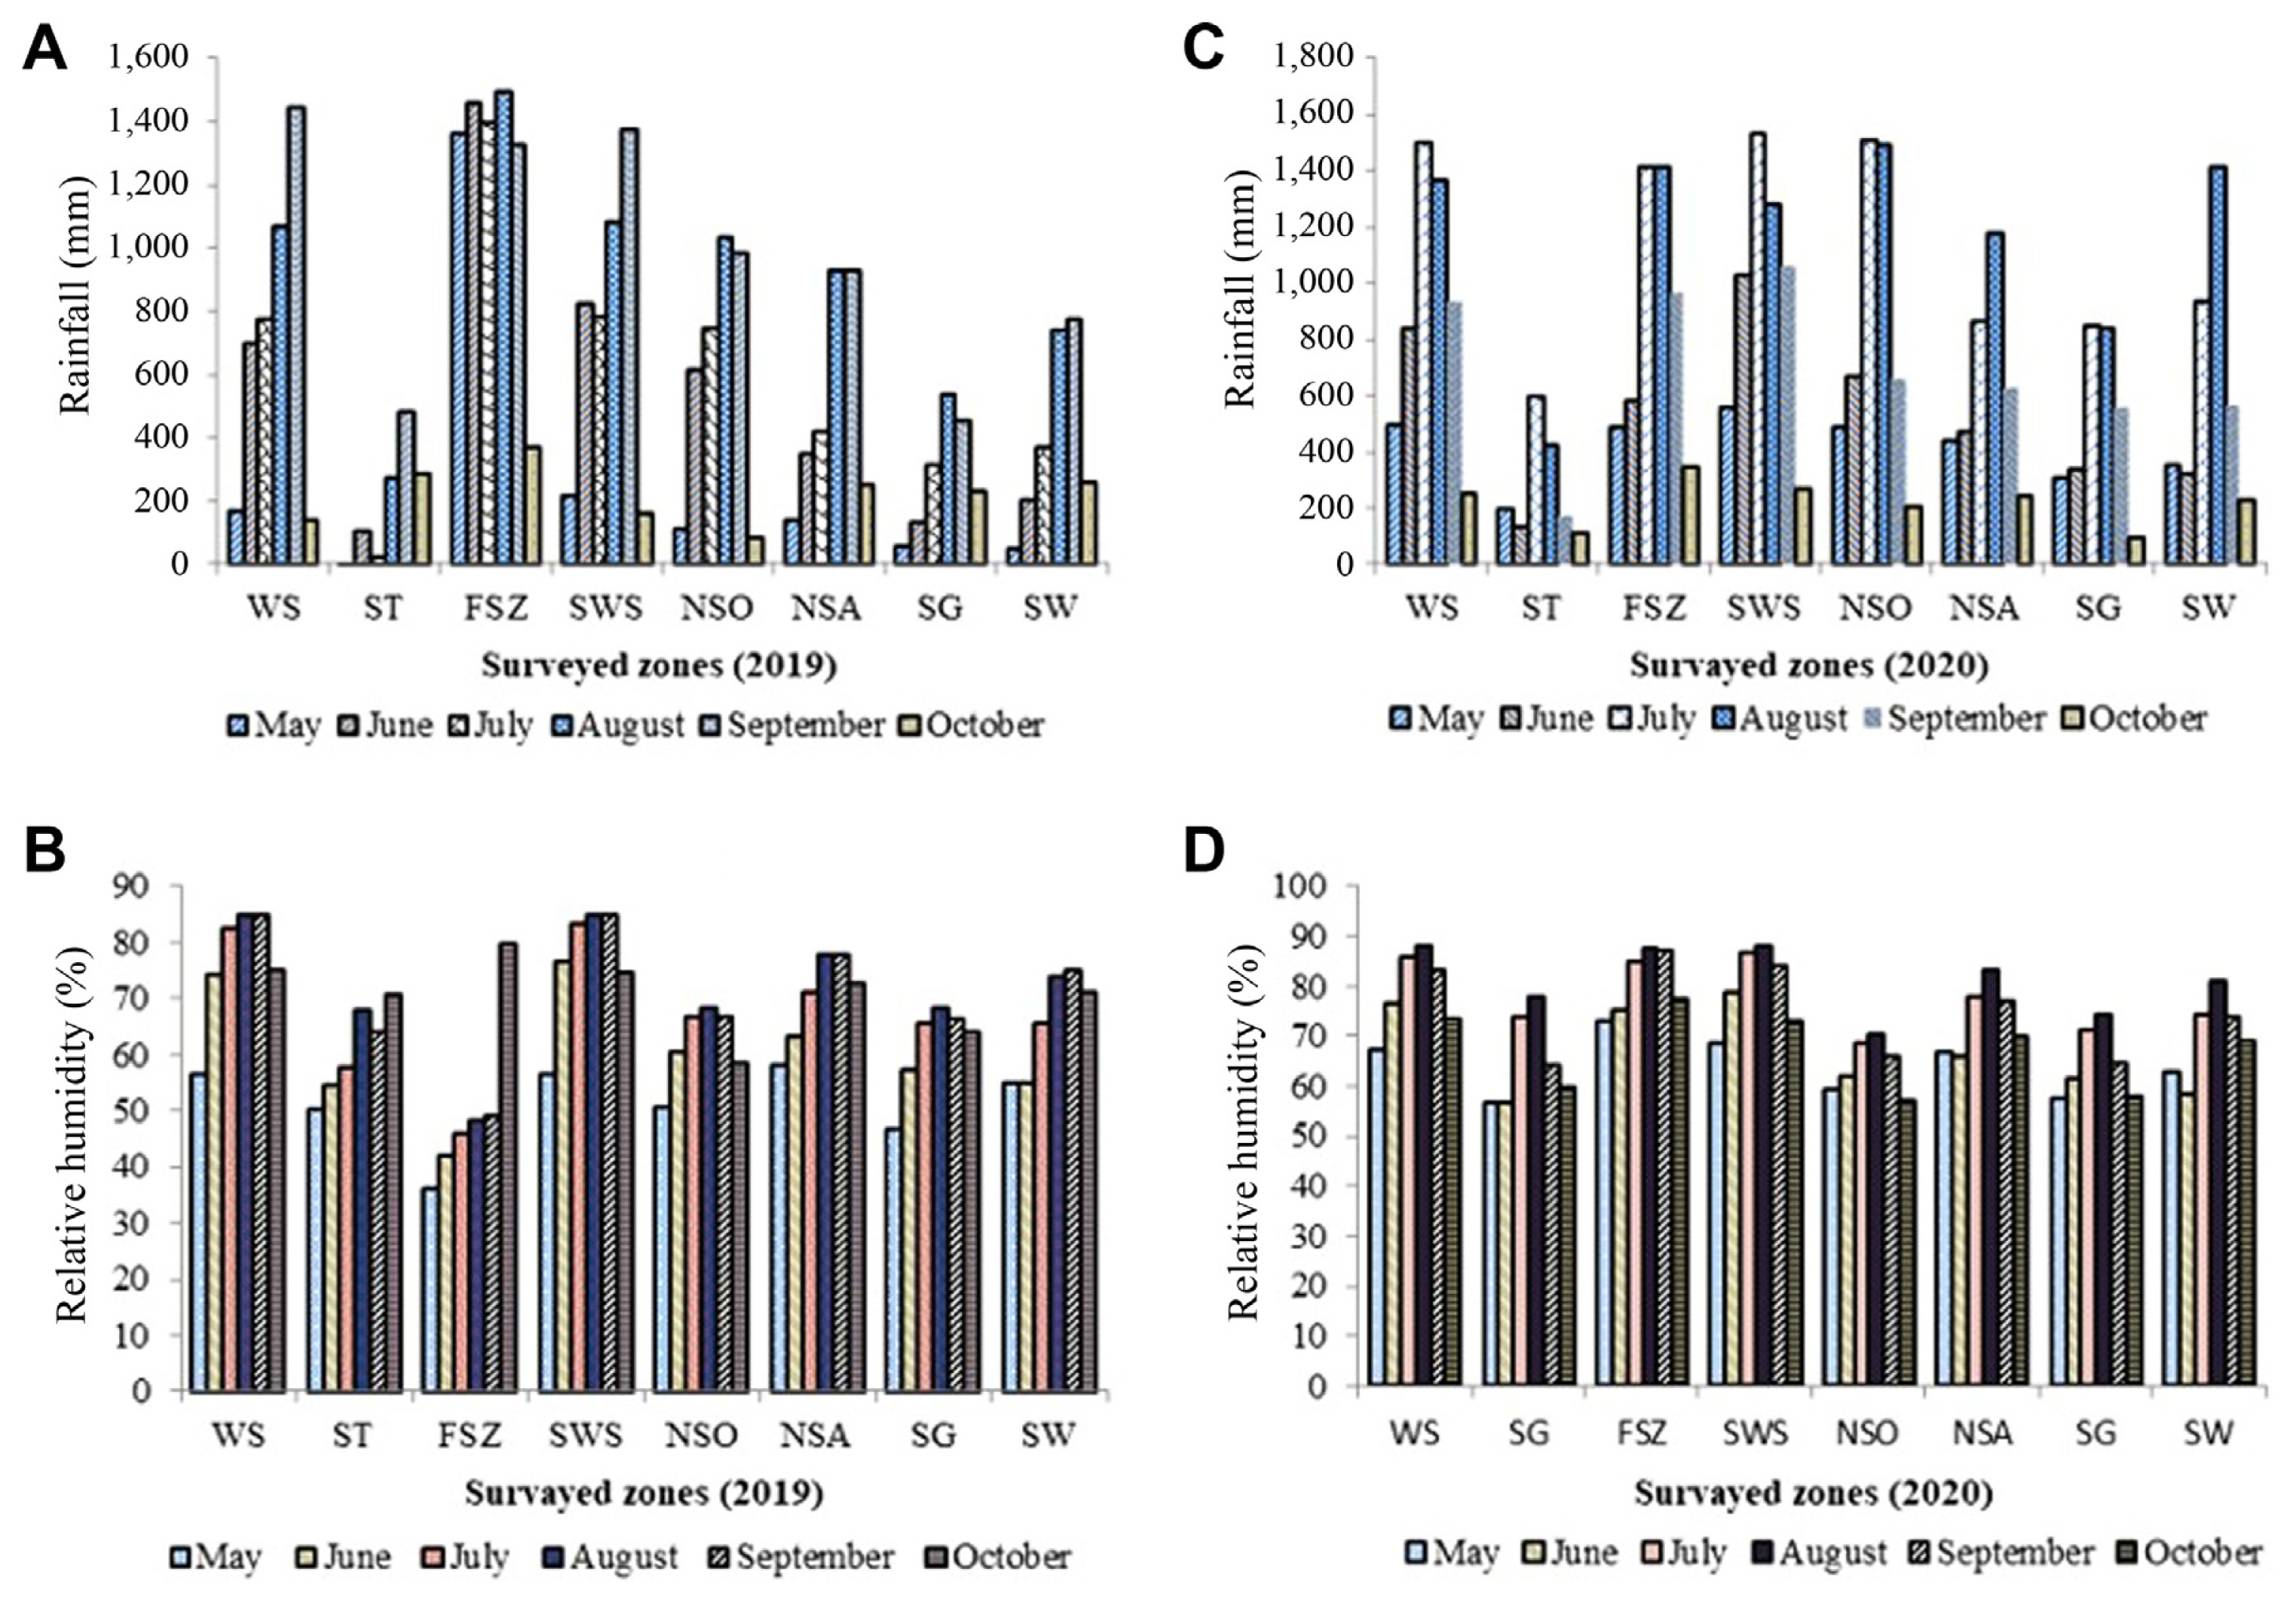
The disease assessment was conducted in three faba bean-producing regions; the Oromia region (North Shewa, West Shewa, Southwest Shewa, Arsi, and Finfinne Special Zone), the Amhara (South Gondar, North Shewa, and South Wollo), and Tigray (South Tigray). Faba bean production potential was taken into account when selecting the regions and zones. Mainly the study areas have differed in altitude, and weather conditions) (Rainfall, Temperature, and relative humidity) (Table 1). The rainfall data of the surveyed districts were obtained from meteorological stations from planting to survey periods during the surveyed year. FBG and other diseases have been assessed from three zones in the 2019 and 2020 main cropping seasons in the Amahara region, from three zones in 2019 and, five zones in 2020 in the Oromia region, and one zone in the Tigray region in 2019 and 2020.
Sampling methods
The sampling structure consisted of three hierarchal levels of faba bean-growing agroecology in Ethiopia. The Amhara, Oromia, and Tigray regions are EthiopiaŌĆÖs highlands of potential faba bean production areas. Within these three regions of faba bean-growing highlands, six zones from the Oromia region and three zones from the Amhara region, and one zone from the Tigray region were selected by purposive sampling. The number of districts from each representative zone was also selected by purposively sampling methods based on production potential, accessibility, and area coverage. A total of 999 faba bean fields (283 in 2019 and 716 fields in the 2020 cropping season) across 50 districts within nine zones in the three regions were assessed in main cropping seasons. In N/Shewa (Oromia) 9 districts (n = 137), W/shewa 10 districts (n = 104), S/W/shewa 6 districts (n = 78), Arsi 7 districts (n = 91), Special zone 2 district (n = 16), N/Shewa (Amhara region) 6 districts (n = 160), S/Gondar 4 district (n = 152), S/wollo 4 district (n = 171), and S/Tigray 3 districts (n = 90) were selected during assessments. The FBG and other faba bean disease assessments from each locality in the districts were selected randomly. Generally, from the assessed faba bean fields, 483 fields were across 13 districts, 426 fields across 34 districts, and 90 fields across 3 districts of Amhara, Oromia, and Tigray regional states, respectively (Table 1).
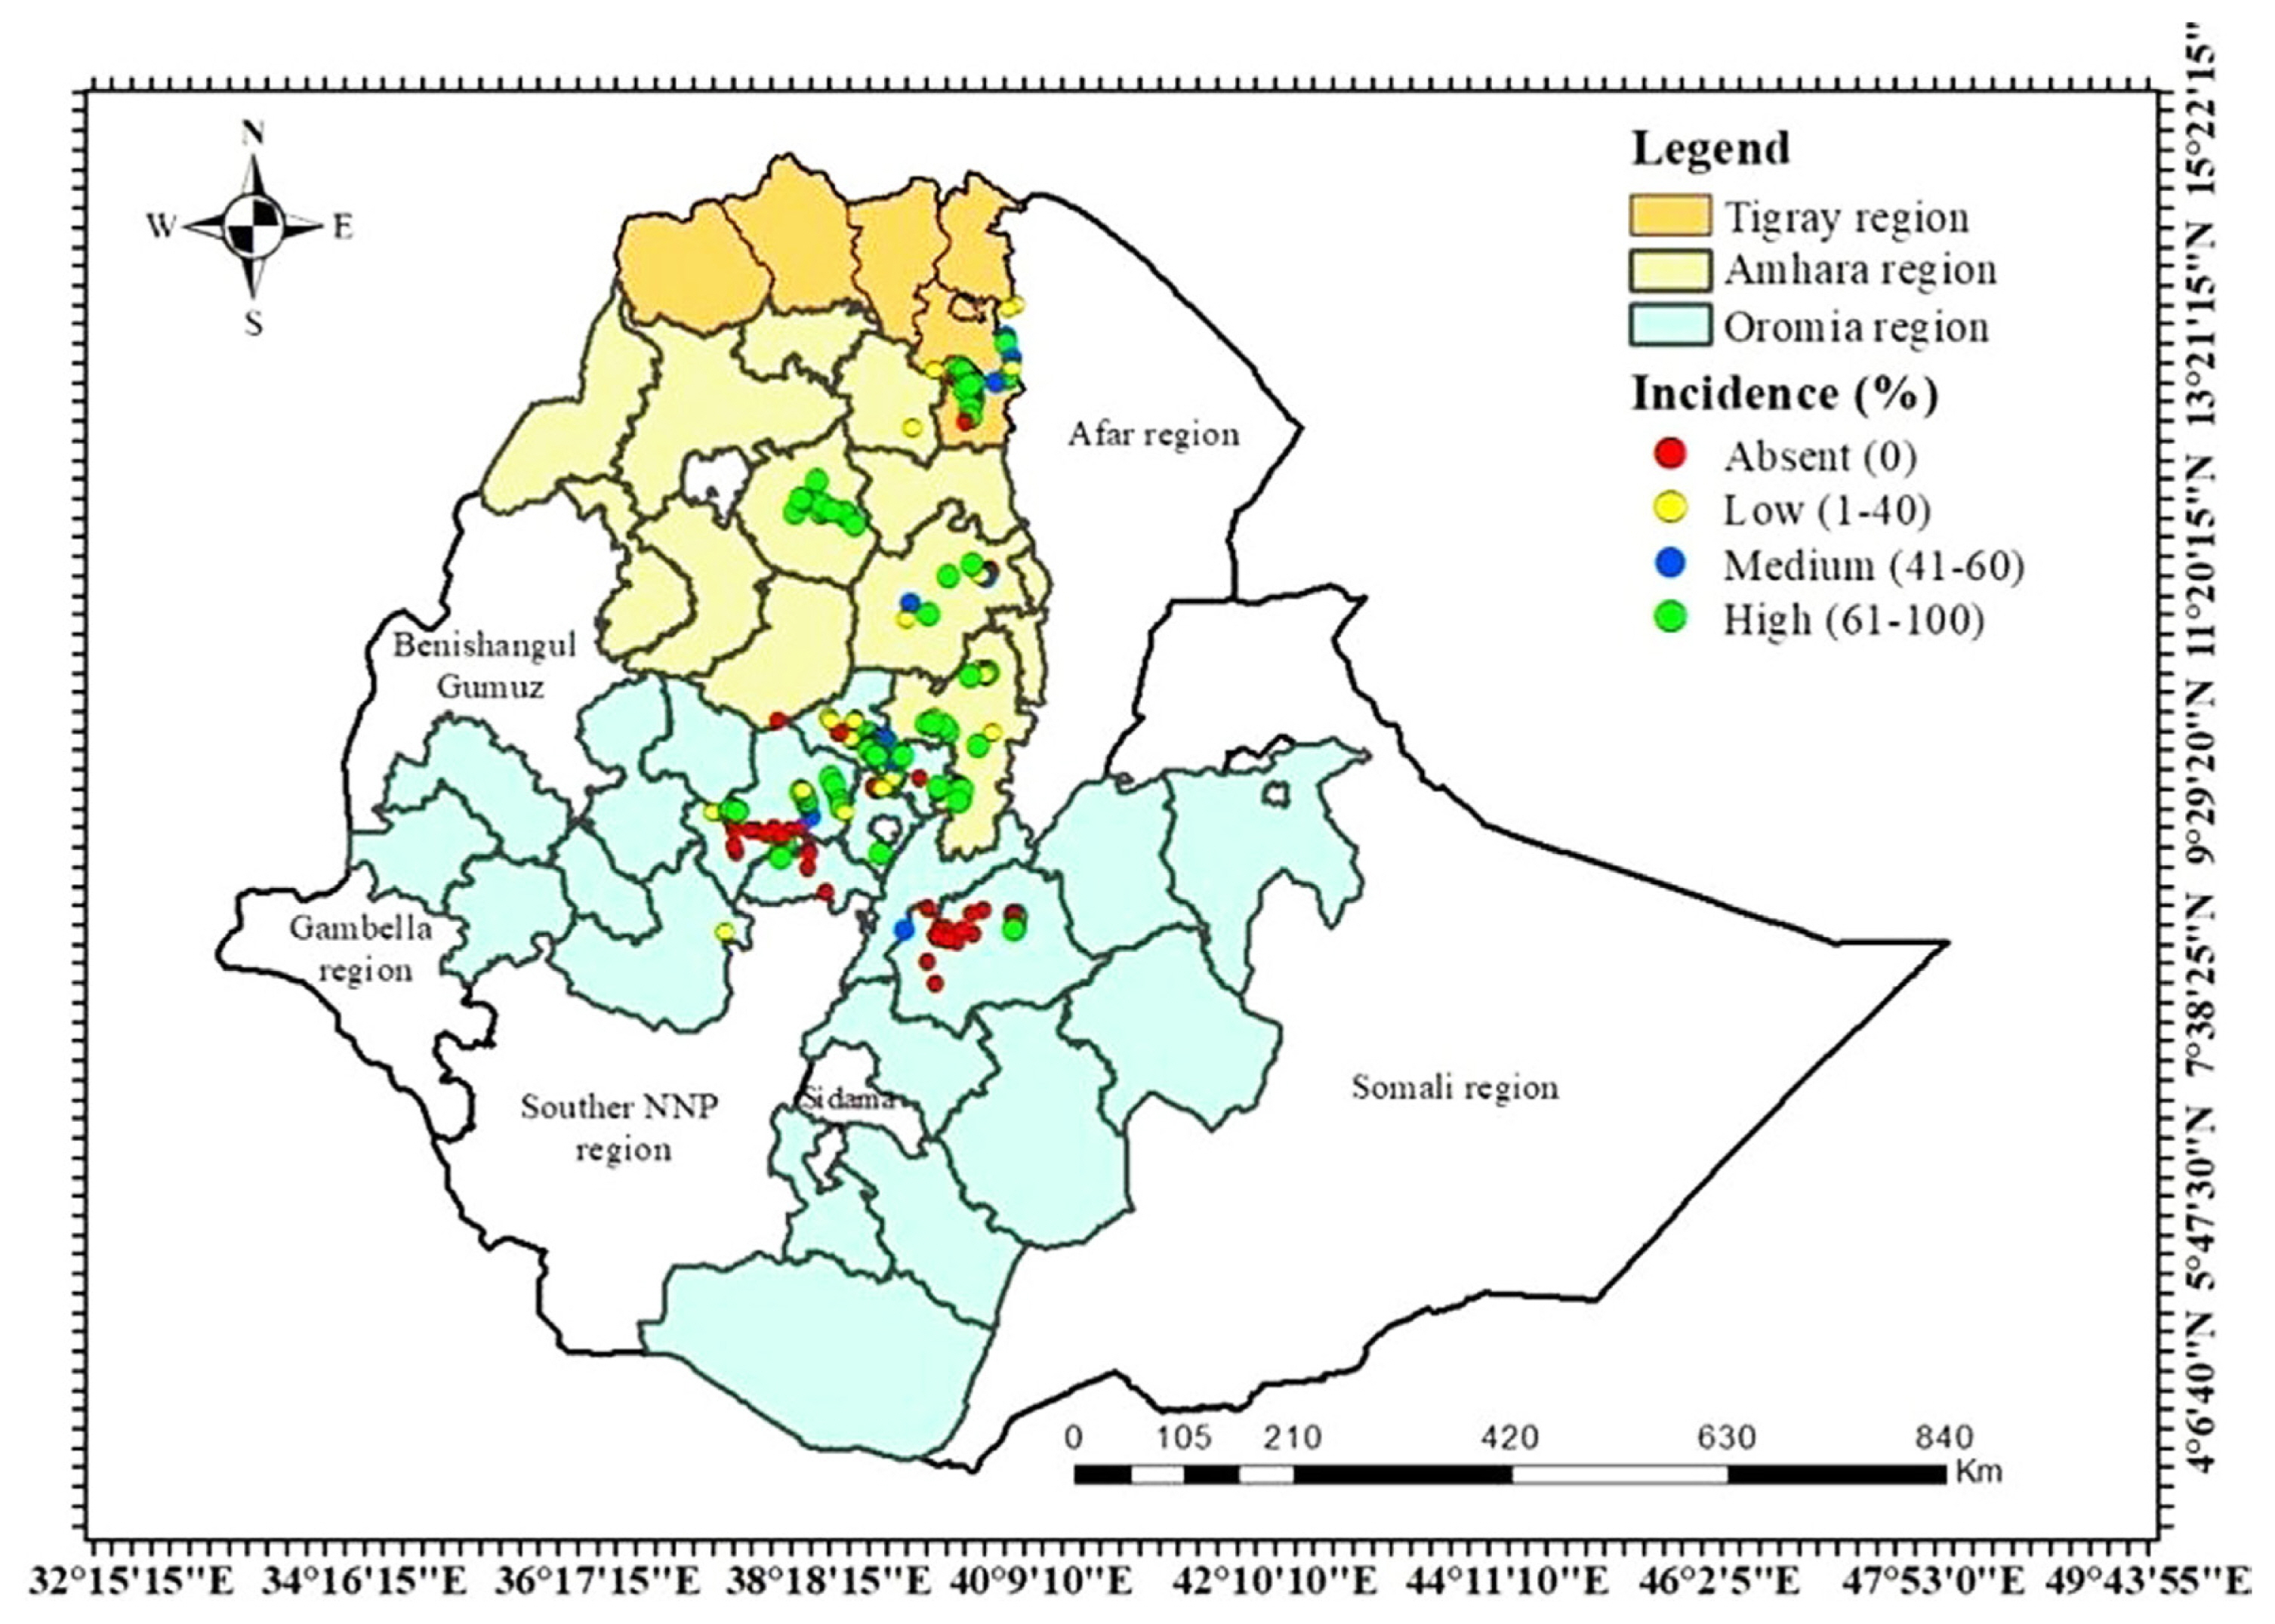
Field surveys were made at two growth stages, i.e., first stage survey (seedling to flowering growth stage) at end of July, and the late-stage survey (podding to maturity growth stage) was conducted at end of September to early October. Each survey site was coordinated with the Global Positioning System (GPS) for mapping disease distribution in Ethiopia. The distribution map of FBG in three regions (Amahara, Oromia, and Tigray) was developed representing the highlands of faba bean-producing areas in Ethiopia.
Identifications were conducted based on previously described and reported symptomology of FBG disease by Hailu et al. (2014) and Bitew et al. (2022) to confirm the typical symptoms of FBG visualized in the faba bean plant and other host species during the assessment periods. The FBG symptoms observed on other host species were confirmed by observing key morphological characteristics such as typical Physoderma zoosporangia, and zoospore structures under a light microscope as described by You et al. (2021).
Disease assessments
Disease assessments were studied by observing fields of faba bean and sampling by following available roads and routes in the selected location with assessment stops at 3-5 km intervals based on vehicle odometer. Five points with a 10 m distance among the quadrants from each faba bean farm were received by throwing a quadrant area of 1 m2 in a walking ŌĆ£XŌĆØ pattern on the farm, and the points were averaged and noted on the datasheet for incidence and severity per farm. Disease incidences were computed as diseased faba bean plants with shows symptoms to a total of faba bean plants examined in the quadrants. Disease severity of FBG was measured based on 15 faba bean plants randomly selected using a modified 0-9 scoring scale where, 0 = no symptom, 1 = very small and few green lesions on the leaves, 2 = very small and green sunken lesions, 3 = many green sunken small lesions, 4 = many small lesions and few large lesions turning into brown color, 5 = many brown color and large lesions, 6 = brown lesions coalescing, 7 = brown large lesions coalescing, 8 = plants darkened and stem collapsed, and 9 = dead plants (Ding et al., 1993).
Ascochyta blight disease symptoms on faba bean plants using the 1-9 disease scoring scales as stated by Hanounik et al. (1987), Chocolate spot severity disease using standard disease scales of 0-9 by Bernier, and Faba bean rust disease using the 1-9 disease scoring scale as stated by International Center for Agricultural Research in the Dry Areas (1986), and faba bean root rot disease as an area of root tissue damaged using a 0-5 rating scale as McFadden et al. (1989) was used to score disease severity on 15 faba bean plant selected in the quadrants.
Disease prevalence (DP), DI, and Percent Severity Index of the FBG and other faba bean diseases were computed based on the following formulas expressed in three separate percent disease indices.
Data analysis
The incidence and severity of FBG were classified into discrete binomial qualitative data groups as previously described by Nayak et al. (2018). As a result, several fields recorded with FBG showing Ōēż35% and >35% incidence, and Ōēż25% and >25% severity were used as class boundaries to generate a binary dependent variable (Table 2). To depict the bivariate distribution of the fields, contingency tables of DIs, prevalence, severity, and independent variables were created (Table 2). The relationships of EthiopiaŌĆÖs highlands of potential faba bean production areas, zones, crop growth stage, the density of crop, cropping system, field slope, cropping pattern, altitude, the density of weeds, type of soil, application of fertilizer, method of drainage, nearby crop type, and ┬▒fungicide spray(s) were investigated using logistic regression by the SAS procedure of GENMOD (Yuen et al., 1996).
The logistic regression model enables the assessment of the significance of several independent variables that influence the response variable (Fininsa and Yuen, 2001). The response variable was the likelihood of FBG incidence exceeding 35% and severity exceeding 25% in a given faba bean field.
The significance of the independent variables was investigated in two methods (Belete et al., 2013). First, the relationship between all independent variables with incidence and severity in a single variable model was considered. This entailed testing the deviation reduction assigned to a variable when that variable was originally introduced into the model. Second, the relationship of an independent variable with FBG incidence or severity was assessed when it was added to the model with all other independent variables. Finally, in the reduced multiple variable models, selected independent variables that have a significant association with FBG incidence or severity when entered first and last into a model were incorporated.
The parameter estimates and standard errors were examined in both single and multiple models using the GENMOD function in SAS. Fininsa and Yuen (2001) demonstrated how to create a deviation table for the final reduced multiple variable models. The likelihood ratio test was used to evaluate the importance of the variables and was compared to the Chi-square value when variables were added to the reduced model (McCullagh and Nelder, 1989). Analysis of deviation, odd ratio, and standard error of new variables in a reduced model demonstrated the role of independent variables and variable classes within the independent variables in determining the importance of FBG incidence.
Results
The FBG and other major diseases of faba bean fields were assessed in the altitude range from 1900 to 3358 m.a.s.l., Rainfall (5 to 1,520 mm), relative humidity (36.3% to 89.5%), and a minimum temperature of 9.5┬░C and maximum of 44.3┬░C) information were obtained from metrological stations to the respective locations from the faba bean planting month (June) until the last month (October) of the survey (Table 1, Fig. 1).
Aggregation of independent variables for the survey of FBG into distinct variable classes within several corresponding fields for each class as presented in Table 2. Out of the total surveyed faba bean fields, high (>2,400 m.a.s.l.) altitudes 53%, mid (2,201-2,399) altitudes 36.6%, and low (1,900-2,200) altitudes 10.3% had been assessed for independent variables of altitude classes. Similarly, faba bean fields of 99% rotating with non-legumens crops showed the lowest incidence and severity of FBG disease as compared to the mono-cropping variable class (Table 2).
Symptomatology and pathogen morphology
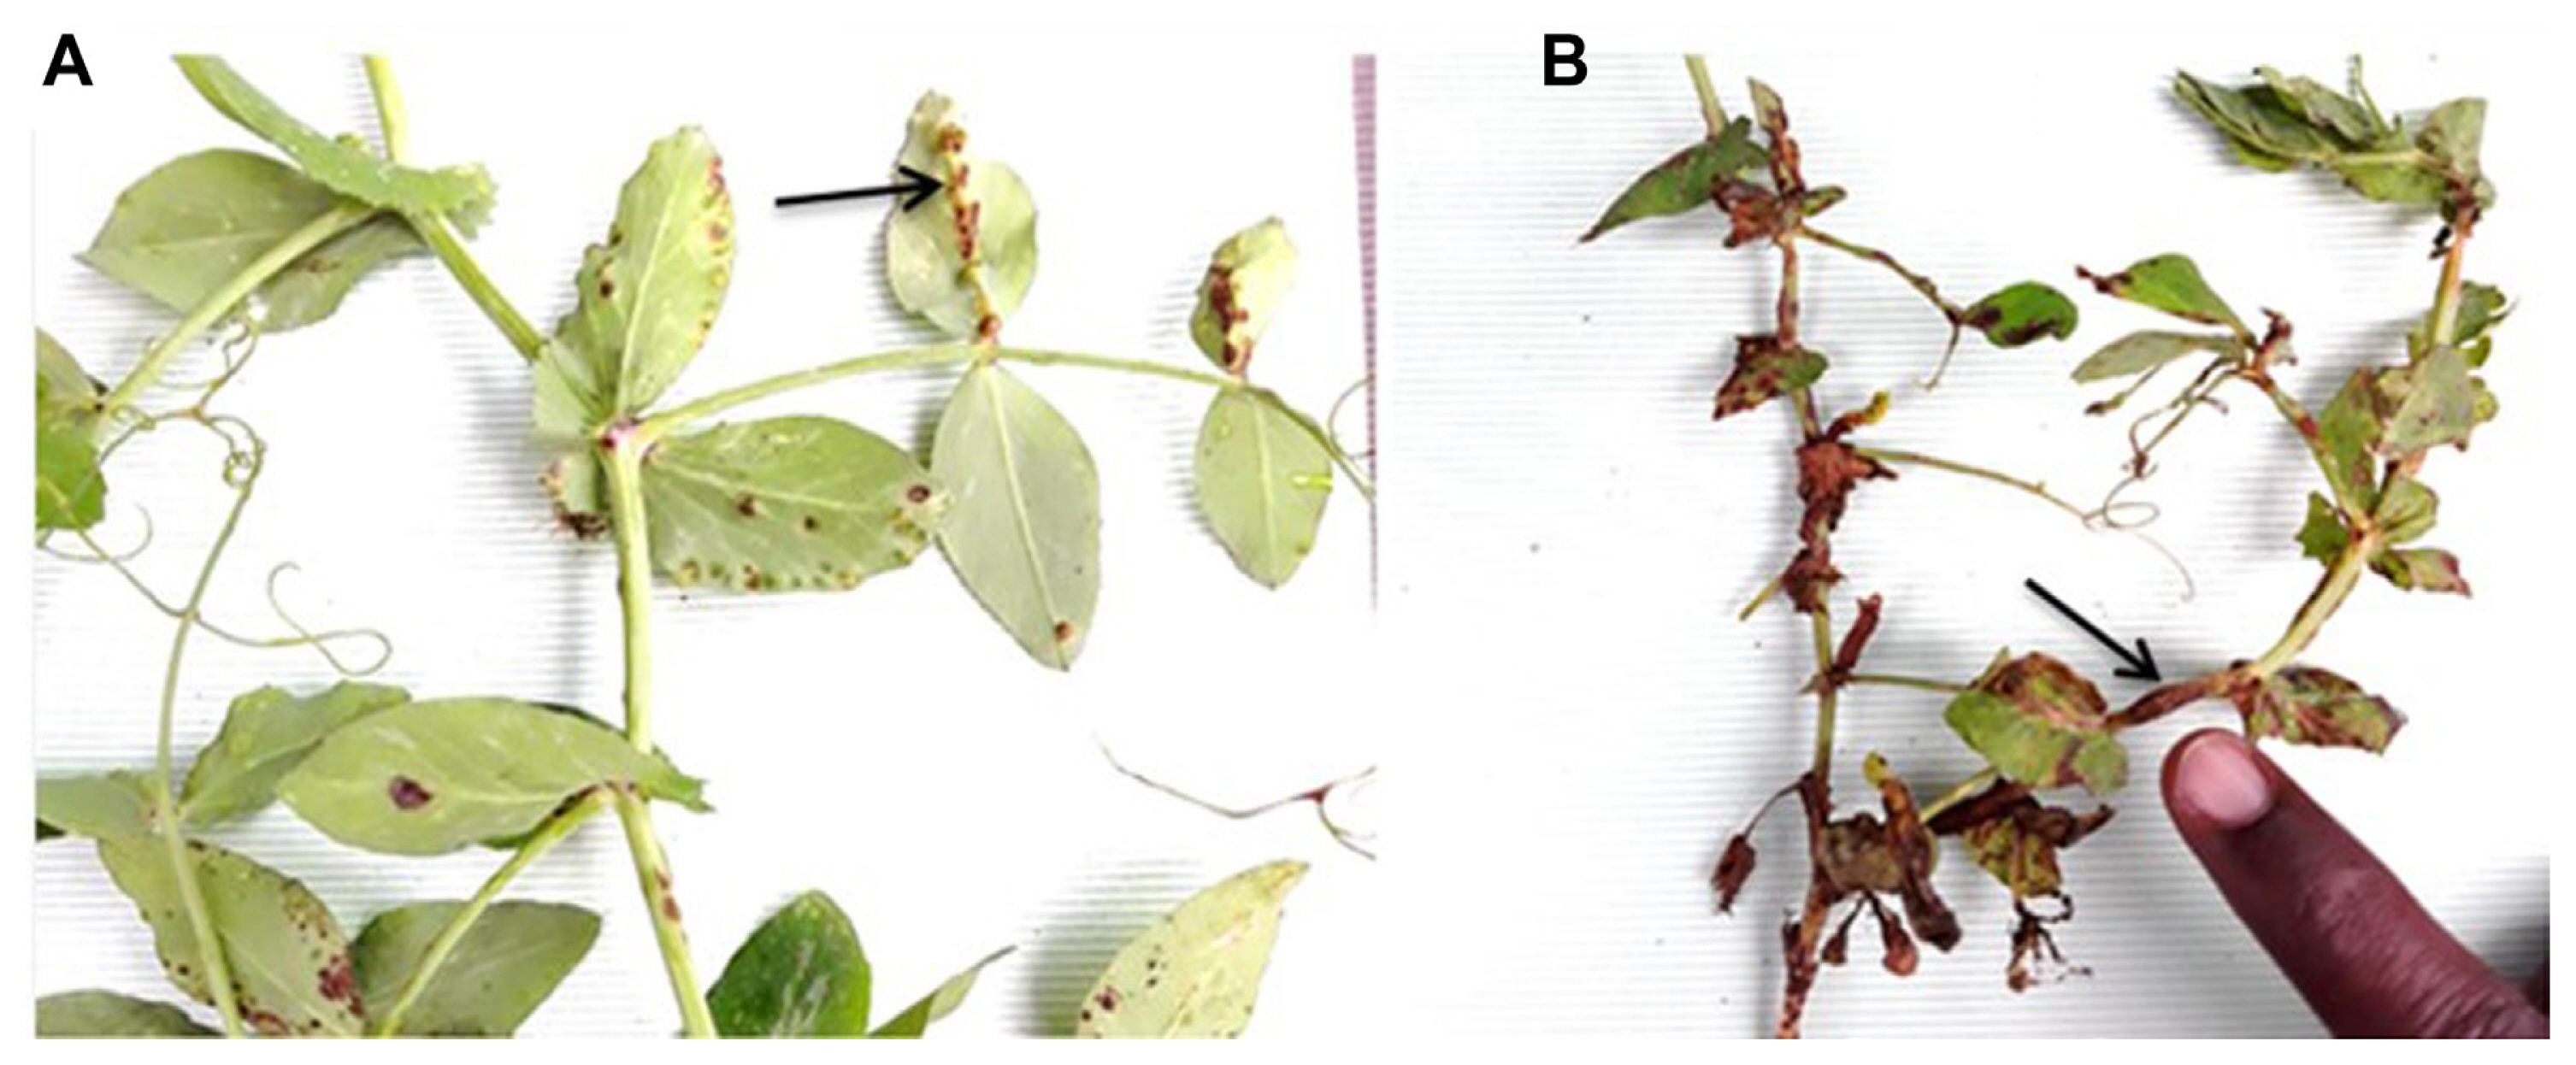
The gall-like symptoms were detected during the assessment periods on above-ground faba bean plant parts on leaves, petioles, stems, and pods as described in Fig. 2A-F. The early infection of FBG symptoms with very small tumor-like swelling (normal green) symptoms was observed on newly emerged faba bean leaves (Fig. 2A). The medium-sized tumor-like swelling (brownish color) on the underside leaves and with depression on the upper leaf surface with mostly uninfected leaf green areas was observed during assessment in the faba bean field (Fig. 2B). The most of faba bean fields assessed were severely infected with irregular, coalesce, and large necrotic galled areas on petiole, leaves, stems, and pods (Fig. 2C-F).
While the faba bean is the major host most severely attacked by FBG, the gall symptoms were also found on other legume crops such as field pea (Pissum sativum) on leaves and stems (Fig. 3). The FBG was also observed attacking the Trifolium spp. and other legume plant species like Vicia sativa (Vetch) and Medicago scutellata.
The typical symptoms of FBG were observed as similar as indicated in Fig. 2. The FBG symptoms observed on other host species were confirmed by observing key morphological characteristics such as typical Physoderma zoosporangia, and zoospore structures under a light microscope.
Incidence and severity of FBG with different independent factors
The overall FBG disease across regions (Amhara, Oromia, and Tigray) and cropping seasons (2019 and 2020) recorded 76.2% prevalence. The prevalence of FBG for the 2019 and 2020 surveyed seasons was recorded at 72.8% and 78.5% respectively (Table 3). The FBG disease was most prevalent in the Amhara region (95.7%), followed by Tigray (83.3%), and less in the Oromia region (54%). The highest prevalence of FBG disease was recorded from the South Gondar zone (98%) and North Shewa (95%), followed by South Wollo (94.2%) zones. The 83.9% and 83.3% of FBG prevalence were obtained from the North Shewa zone of Oromia and the South Tigray zone respectively. The minimum FBG DP was observed in Arsi (33%), West Shewa (14.5%), and Southwest Shewa (10.8%) zones in the Oromia region.
In the faba bean fields where the FBG was assessed, DI and severity were influenced by different biophysical factors such as crop growth stage, crop density, cropping system, altitude, weed density, application of fertilizer, method of drainage, nearby crop, and application of fungicide (Table 3). The lowest incidence (8.6%) and severity (3.6%) were obtained from the faba bean field practiced crop rotation with non-leguminous crops (cereal and vegetable crops). In contrast, 58.2% incidences and 22.07 severity percentage of FBG disease were recorded from the faba bean field with a mono-cropping system. The highest DI (81.3%) and severity (29.8%) were recorded from an independent variable class of maturity growth stage, whereas the lowest incidence (45.5%) and severity (15.07%) were received from the seedling growth stage. The higher mean incidence (69.3%) and severity (25.7%) were observed in faba bean fields with infested with higher weed density as compared to fields with low weed density of incidence (44.7%) and severity (17.6%). Faba bean fields situated at high altitudes (>2,400 m.a.s.l) had the highest FBG incidence (74.1%) and severity (28.5%) as compared to areas with medium altitudes (2,201-2,399 m.a.s.l) and lower altitudes ranged (1,900-2,200 m.a.s.l.) (Table 4). Inorganic (NPS: nitrogen, phosphate, and sulfur with the ratio of 19% N, 38% P2O5, and 7% S) fertilizer application to faba bean fields at sowing time was found associated with the lowest incidence (51.4%) and severity (16%) of FBG disease as compared to faba bean fields that did not receive any type of fertilizer. Faba bean fields near legume crops had the highest DI (74.1%) and severity (26.1%), whereas faba bean fields near cereal crops had the lowest incidence and severity (55.06% and 21.3%, respectively). Faba bean fields sprayed with fungicide had the lowest incidence (46.7%) and severity (9.3%) of FBG compared to faba bean fields that did not receive any fungicide (67.6% incidence, 33.2% severity) (Table 3).
The distribution map of FBG disease in Ethiopia through the Amahara, Oromia, and Tigray regions was created to depict the highlands of faba bean-producing areas. In general, the total FBG DI varied from 0% to 100% in all examined faba bean fields with the highest distribution range from 61% to 100% (Fig. 4).
Other foliar and root rot diseases of faba bean
The combined means for years 2019 and 2020 assessments for prevalence, incidence, and severity of chocolate spot, Ascochyta blight, faba bean rust, and root rot diseases found in various zones in the three surveyed regions are summarized in Table 4. Chocolate spot is more prevalent and was more common in the West Shewa (100%), Finfinne Special Zone (100%), and North Shewa (99%) of the Oromia region, followed by South Gonder (98%) and North Shewa (95%) of Amahara region. Ascochyta blight prevalence was found in Finfinne Special Zone (100%), North Shewa (98%), West Shewa (98%), and Southwest Shewa (97%), followed by the Arsi zone (91%) of the Oromia region. Except for faba bean rust in South Wollo, no faba bean rust or root rot disease was detected in the Amhara region. The incidence of major faba bean diseases tended to follow a similar pattern as found for DP (Table 4).
Factors associated with FBG disease
When independent variables such as the assessed region, zone, year, crop growth stage, cropping system, altitude, weed density, and fungicide application are entered first into the logistic regression model, they are strongly associated with FBG incidence and severity. When slope, soil type, drainage methods, and crop nearby were entered first into the logistic model, they exhibited no association with FBG incidence and severity (Table 5).
The independent variables of surveyed regions, surveyed year, zones, crop growth stage, altitude, crop density, weed densities, cropping pattern, cropping system, fertilizer application, crop nearby, and fungicide spray, when variable entered first (VEF) into the model for FBG incidence, the highest deviance reduction, and best probability values, were observed. Similarly, when the variable entered last (VEL) into the model for FBG incidence the surveyed region, surveyed year, zones, altitude, weed density, cropping system, and soil type, fungicide application showed the greatest deviance reduction and best probability values. The surveyed region, surveyed year, zones, crop growth stage, crop density, cropping system, the slope of the field, cropping pattern, altitude, weed density, fertilizer application, and fungicide application when VEF into the model for FBG severity showed the greatest deviance reduction and best probability values. In addition, the surveyed region, surveyed year, zones, crop growth stage, crop density, cropping system, the slope of the field, cropping pattern, altitude, weed density, and fungicide application when entered last into the model for FBG severity showed the greatest deviance reduction and best probability values (Table 5).
In reduced multiple variable models, clustered variables of surveyed regions, year, zones, crop growth stage, crop density, cropping system, field slope, cropping pattern, altitude, weed density, soil type, fertilizer application, and fungicide were statistically tested as presented in Table 6.
The analysis results of deviance for the variables added one by one to the reduced model showed the importance of each variable and variable class. The deviance value, parameter estimates, and standard error of new variable classes in a reduced model have resulted in FBG DI and severity are given in Tables 6 and 7. The highest FBG incidence recorded from the assessed faba bean field has a high probability of association with the surveyed year 2020, Amhara region, South Gondar and North Shewa zone (Amhara), maturity growth stage, mono-cropping, high altitude (>2,400 m.a.s.l), high weed infestation, and unsprayed fungicide (Table 6). Whereas, the surveyed year 2019, Oromia region, West Shew, S/W/Shewa zone, seedling growth stage, lower-altitude (1,900-2,200 m.a.s.l.), crop rotation, low weed infestation (>100/m2) and sprayed fungicide had associated with the lowest FBG incidence (Table 6). Tigray region, 2020 surveyed year, North Shewa (Oromia), maturity growth stage, mono-cropping system, high altitude (>2,400 m.a.s.l.), high weed density (>100/m2), and unsprayed fungicide were associated with the highest FBG severity (Table 7). The lowest FBG severity assessed in the surveyed year of 2019, Oromia region, Southwest Shewa, and Arsi zone, seedling growth stage, crop-rotation system, low altitude ranges (1,900-2,200), low weed densities, sprayed fungicide of the faba bean field had shown a high likelihood of association (Table 7).
Discussion
The present study showed that FBG gall disease is rapidly spreading from its original point to previously uninfected faba bean production areas and continues to increase in overall severity across affected regions of Ethiopia. The appearance of FBG disease was first reported from North Shewa by Gorfu et al. (2012) and subsequent wider spatial and temporal distribution was reported in the northern and central highlands of Ethiopia by Hailu et al. (2014), in the Wollo highlands Hailemariam et al. (2016), in the Emba-Alaje, Ofla, Enda-Mekhoni, and Raya-Alamata districts of south Tigray zone Abebe et al. (2018), in the North Shewa zone of the Amahara region Bitew (2015), in the western highlands of Oromia region by Debela et al. (2017), and the South Gondar of Amhara region by Ademe et al. (2018). The rapid spread and high prevalence, incidence, and severity of FBG were likely due to many factors, including inappropriate farm management practices, absence of resistant varieties, lack of a disease-free seed supply, and lack of attention on internal quarantine to address the substantial farmer-to-farmer seed exchange system. A similar study report from China showed that FBG pathogen inoculum could be minimized from season to season, from existence distributed from an infested area to uninfested areas through simple practices such as selecting and using disease-free seed, including disinfecting seed before planting (Lang et al., 1993).
The altitudinal variation in surveyed zones of the Amhara, Oromia, and Tigray regions had a very significant impact on FBG DI and severity. A previous survey reported that as the elevation of faba bean production increased, the incidence and severity of FBG disease correspondingly increased (Bitew et al., 2021; Hailemariam et al., 2016; Hailu et al., 2014; Yitayih et al., 2021). Similarly, in China, FBG is one of most problematic in highland areas at an elevation of 2,500-3,400 m (Lang et al., 1993).
The current study also highlighted how rotating the faba bean with other non-legume crops (e.g., horticultural and cereal crops) substantially lowered DI and severity compared to the fields planted to faba bean after a faba bean or another legume crop. As cereal crops are a non-host to FBG, there is an opportunity for farmers to rotate faba bean crops with cereals and other non-legume crops to reduce the pathogen inoculum source in the soil (Getaneh et al., 2018).
Faba bean fields infested with a high weed density showed higher rates of FBG compared to fields infested with a low weed density. Similar findings that high weed-infested faba bean fields show increased FBG DI and severity as compared with low weed density were previously reported by Bitew et al. (2021), Yitayih et al. (2021), and Hailemariam et al. (2016).
Maximum FBG disease severity and incidence occurred from podding onwards across the maturity stages as compared to seedling, vegetative, and flowering stages. This is due to continuous high rainfall, and cool temperatures in the highland areas, especially in the September and October months which create particularly favorable conditions for the production and release of FBG inoculum (zoospores), zoospore easy movement by run-off water, and rain splash. The FBG disease onset may depend on weather conditions (rainfall, cool environment, and the source of inoculum). If the previous yearŌĆÖs farm is cultivated with faba bean and the important environmental conditions are maintained, it will start at an early stage (seedling stage) on the next season planted of the same or similar crop. The disease progress decreased toward the late growth stage of faba bean as the grower early applied fungicide. Accordingly, Getaneh et al. (2018) noted that the combined presence of rain, wind, and zoospore release in the field results in rapid disease spread that peaks around pod formation, and then gradually subsides. The recent study by Yitayih et al. (2021) noted that vegetative and flowering stages had higher FBG DI and severity than podding growth stage. However, in the study by Yitayih et al. (2021), fungicide had been applied at the vegetative stages in the study area, likely resulting in a low DI and severity at the later growth stage.
The occurrence of other faba bean diseases such as; chocolate spot, ascochyta blight, faba bean rust and root rot are important of faba bean disease reported from the assessment areas, except root rot disease absent in all surveyed zones of Amhara region and faba bean rust only observed in South Wollo again from Amhara region.
Recommendation
FBG was the most prevalent in faba bean production areas, particularly in the South Gondar, South Wollo, and North Shewa of the Amhara region, North Shewa zone of the Oromia region, and South Tigray zone of Tigray region. Furthermore, in Ambo, Jeldu, Dendi, Chelia, and Midakegn districts from the West Shewa zone, and Chitu district from the Southwest Shewa zone of the Oromia region highland areas was reported from present study as newly infested faba bean production fields with FBG disease. A logistic regression model highlighted the relationship between the different independent factors and FBG incidence and severity during the assessment periods of 2019 and 2020. The independent variable classes of the crop at podding and maturity stages, mono-cropping, altitudes greater than 2,400 m.a.s.l., high weed density, and unsprayed faba bean fields with fungicide as being significantly associated with the highest disease intensity, indicating that these are likely important factors for FBG epidemics. Crop rotation; faba bean production at altitude ranges from 1,900 to 2,200 m.a.s.l., and from 2,201 to 2,399 m.a.s.l.; low weed infestation in faba bean field; fungicide application can all be considered as management opportunities towards limiting the adverse FBG impact on faba bean. Whereas FBG may overriding cause of devastating faba bean yield losses, it remains important to also monitor and manage the other faba bean diseases to minimize overall losses from diseases. Finally, further investigation of disease biology and ecology, active and passive FBG pathogen inoculum transmissions, defining the diversity of Ethiopian FBG pathogen isolates, and FBG interactions with other co-occurring pathogens could be important foci for future studies.

 PDF Links
 PubReader
 ePub Link
 Full text via DOI
 Full text via PMC
 Download Citation
 Print
Print