Plant Pathol J > Volume 40(2); 2024 > Article
Lee, Lee, and Kwak: Genetic Variation of Monilinia fructicola Population in Korea

Abstract

Brown rot disease, caused by Monilinia spp., poses a significant threat to pome and stone fruit crops globally, resulting in substantial economic losses during pre- and post-harvest stages. Monilinia fructigena, M. laxa, and M. fructicola are identified as the key agents responsible for brown rot disease. In this study, we employed the amplified fragment length polymorphism (AFLP) method to assess the genetic diversity of 86 strains of Monilinia spp. isolated from major stone fruit cultivation regions in South Korea. Specifically, strains were collected from Chungcheong, Gangwon, Gyeonggi, Gyeongsang, and Jeolla provinces (-do). A comparative analysis of strain characteristics, such as isolation locations, host plants, and responses to chemical fungicides, was conducted. AFLP phylogenetic classification using 20 primer pairs revealed the presence of three distinct groups, with strains from Jeolla province consistently forming a separate group at a high frequency. Furthermore, M. fructicola was divided into three groups by the AFLP pattern. Principal coordinate analysis and PERMANOVA were applied to compare strain information, such as origin, host, and fungicide sensitivity, revealing significant partition patterns for AFLP according to geographic origin and host plants. This study represents the utilization of AFLP methodology to investigate the genetic variability among M. fructicola isolates, highlighting the importance of continuous monitoring and management of variations in the brown rot pathogen.

Worldwide, major fungal pathogens associated with stone fruit diseases include Alternaria spp., Botrytis cinerea, Colletotrichum spp., Monilinia spp., Phomopsis vexans, Phyllosticta circumscissa, Podosphaera tridactyla, and Septoria cerasina (Martini and Mari, 2014; Oh et al., 2017). Among them, Monilinia is a genus of fungi in the Sclerotiniaceae family, known to cause significant losses in various Rosaceae fruits and stone fruits (Oh et al., 2017). Brown rot disease caused by fungi in the Monilia genus inflicts significant economic damage during pre-harvest, post-harvest, storage, and transportation (Rural Development Administration, 2007). Brown rot disease manifests initially as small brown spots on the fruit surface. As the disease progresses, these spots enlarge into sunken lesions, leading to a reduction in fruit yield and compromising its marketability (Choi et al., 2016; Hu et al., 2011).
The genus Monilinia is responsible for the brown rot disease. Globally, Monilinia fructicola, M. fructigena, and M. laxa are the most common species all over the world (De Miccolis Angelini et al., 2018; Shim et al., 2007). Among them, M. fructicola is predominantly reported in the United States, Australia, New Zealand, and some parts of Europe and Japan. M. fructigena is prevalent in Europe and Japan, while M. laxa is documented to be distributed in the United States, Australia, Europe, and Japan (Fulton and Brown, 1997; Hu et al., 2011; Shim et al., 2007). In particular, in Korea, M. fructicola has been reported to cause brown rot disease in fruits such as peaches, plums, apricots, and plum cherries (Zhu et al., 2005). The control of stone fruit brown rot disease depends on chemical and cultivation methods (Martini and Mari, 2014). In terms of cultural control, practices involve removing dead leaves for improved ventilation, and early removal and incineration of infected branches and fruits (Lee and Kwak, 2023). Another approach is plowing the soil in the outbreak area until early spring to bury the pathogen deep within the soil. Chemical control involves the application of various fungicides during the onset of the disease (Hrustić et al., 2018).
To control brown rot disease, synthetic fungicides, including methyl benzimidazole carbamates (MBC), sterol biosynthesis inhibitors, succinate dehydrogenase inhibitors (SDHI), demethylation inhibitors (DMI), and quinone outside inhibitors (QoI), constitute the primary means of pathogen control. MBC-class fungicides such as benomyl and thiophanate-methyl are commonly used. Additionally, there are DMI group fungicides like tebuconazole and bitertanol, QoI group fungicides like pyraclostrobin, and SDHI group fungicides such as boscalid (Jones and Ehret, 1976; Lesniak et al., 2021; Usman et al., 2021). However, repeated use of fungicides has diminished the sensitivity of pathogens to the fungicides, reducing the effectiveness of the fungicides. Consequently, this has led to the emergence of resistant strains against the fungicides (Kim, 2000). In 1978, the first instance of resistance in brown rot pathogens to dicarboximide and benzimidazole fungicides was reported (Sztejnberg and Jones, 1978). For over 30 years, DMI fungicides have been used for the control of brown rot. During this period, variants of brown rot exhibiting resistance to DMI fungicides, along with the associated genetic factor ‘Mona’, a 65-bp sequence element that regulated MfCYP 51 expression, have been reported (Luo and Schnabel, 2008; Schnabel et al., 2004). In Korea, resistance to fungicides for brown rot has been reported since the 1970s. Currently, resistance to benzimidazole-class fungicides such as carbendazim, benomyl, and thiophanate-methyl, as well as dicarboximide-class fungicides like iprodione and procymidone, has been documented (Lim et al., 1998).
Disease symptoms did not allow for the differentiation of Monilinia species infecting both stone and pome fruits. Therefore, achieving a diagnosis at the species level often necessitates the evaluation of a combination of traits, encompassing colony morphology in vitro and DNA sequence characteristics (Côté et al., 2004; Gell et al., 2007; Lane, 2002). Analyzing the genetic structure of Monilinia populations yields insights into the origins of genetic variation, isolated regions, fungicide resistance groups, and host plant associations (Fulton et al., 1999). The internal transcribed spacer region (ITS) of rDNA exhibits sufficient resolution (5-13 nucleotide substitutions) to distinguish these three Monilinia species, but it provides little information on intraspecies variation (van Leeuwen et al., 2002). Investigations into phylogenetic relationships and genetic variations based on morphological and cytological traits can be influenced by environmental factors (Basu et al., 2004; Kumar et al., 2009; Sammour et al., 2013). Therefore, molecular markers have emerged as powerful tools for assessing genetic diversity and phylogenetic relationships in fungi.
Therefore, to achieve successful and efficient disease management within the same species groups, it is necessary to monitor genetic diversity. Amplified fragment length polymorphism (AFLP) is a suitable method to evaluate population variation and diversity at the genomic DNA levels (Vos et al., 1995). Among various molecular markers, the AFLP molecular marker system has been reported to successfully reveal genetic variations among or within populations that cannot be distinguished through morphological or other molecular tools (Majer et al., 1996; Purwantara et al., 2000; Schnieder et al., 2001). This study represents the first application of the AFLP technique to investigate the causal agent of brown rot disease, M. fructicola, in Korea. This study was designed to observe the genetic diversity of M. fructicola in Korea. AFLP analysis with principal coordinate analysis (PCoA) was conducted on 86 strains, utilizing isolated regions, chemical fungicide responsiveness results, and host plants for sampling to evaluate the relationship between the genetic diversity and characteristics of each strain.

Materials and Methods

Pathogen isolates and culture conditions

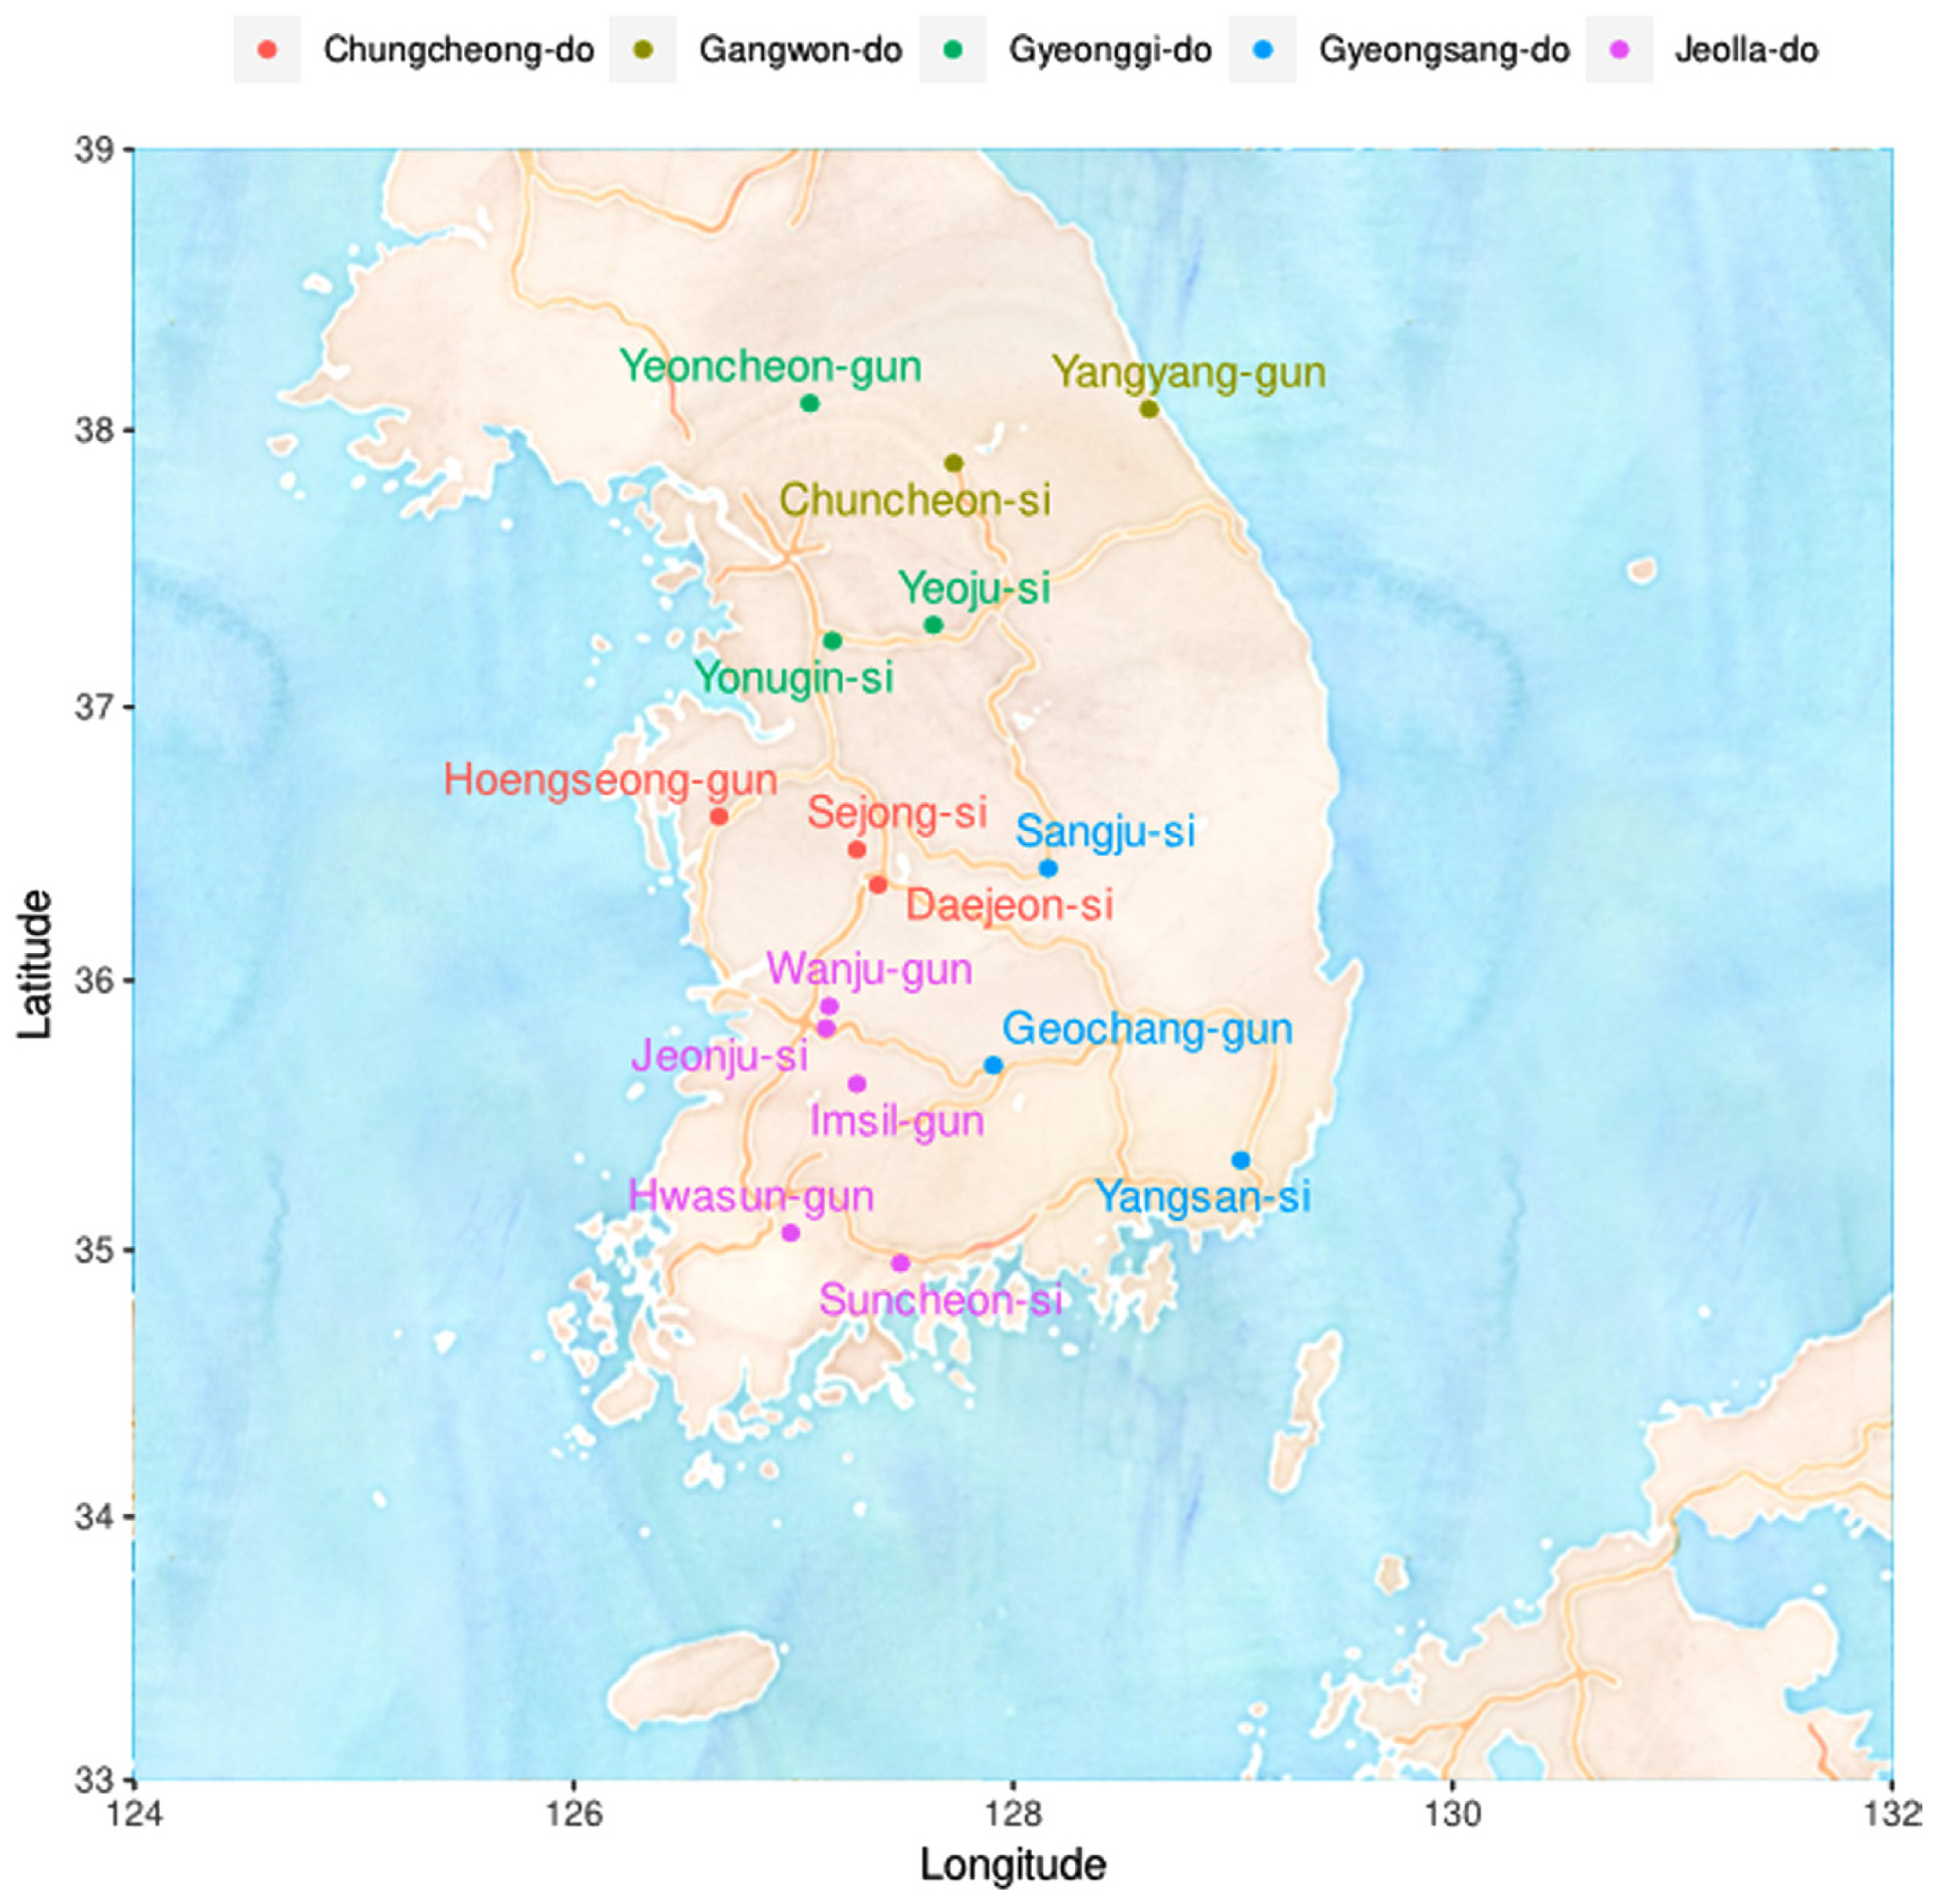
A total of 86 single-spore isolates of M. fructicola were included in the study. The isolates were collected from a wide range of hosts comprising pome and stone fruits from various locations in Korea (Table 1, Fig. 1): 58 isolates from peach (Prunus persica), 10 from apricot (Prunus armeniaca), 3 from Japanese plum (Prunus salicina), 3 from plum (Prunus mume), 9 from pluot (Prunus salicina × armeniaca), and 3 from cherry (Prunus pauciflora Bunge). All collected isolates were cultured from sporodochia originating from various parts of infected host tissues. Isolates were maintained on potato dextrose agar (PDA; potato dextrose 20 g, agar 15 g per liter) medium in Petri dishes in the dark condition at 25°C. For long-term storage, the isolated fungi were preserved at −80°C with a solution containing 20% glycerol and 17% skim milk.

Genomic DNA extraction and identification of the pathogen

For molecular identification of the isolated pathogens, DNA extraction was carried out. The isolated pathogens were inoculated onto one-fifth strength PDA (potato dextrose 4.8 g, agar 15 g per liter) and cultivated at 25°C for 10 days. The cultivated pathogens were subjected to DNA extraction using the cetyltrimethylammonium bromide (CTAB) method. Fungal spores and mycelium were transferred to a 1.5-ml E-tube containing 500 μl of CTAB (CTAB 2.0% (w/v), 100 mM Tris-HCl, pH 8.0, 20 mM EDTA pH 8.0, 1.4 M NaCl), and 8 μl of proteinase K solution (20 mg/ml) was added. The mixture was then crushed, and a 30 min reaction was carried out 65°C. After the reaction, it was cooled at room temperature for 10 min, followed by the addition of PCI (phenol:chloroform:isoamyl alcohol, 24:25:1) 500 μl, mixed by inverting 5 to 7 times. The mixture was centrifuged at 12,470 ×g for 10 min to remove proteins. The supernatant was transferred to a new E-tube, and 400 μl of isopropanol was added. After centrifugation at 12,470 ×g for 5 min at 4°C, the supernatant was removed. Finally, 70% ethanol (500 μl) was added, centrifuged for 5 min, and the supernatant was removed. The pellet was air-dried for 1-2 h. The DNA concentration was measured by adding 20 μl of TE buffer to the E-tube and using the NanoDrop 2000C spectrophotometer (Thermo Scientific, Waltham, MA, USA). The extracted DNA was used for the amplification of the ITS, TEF1-α, β-tubulin, and cytB regions. The primers used were ITS1 (5′-TCC GTA GGT GAA CCT GCG G-3′)/ITS4 (5′-TCC TCC GCT TAT TGA TAT GC-3′) for the ITS region, EF1-728F (5′-CAT CGA GAA GTT CGA GAA GG-3′)/EF1-986R (5′-TAC TTG AAG GAA CCC TTA CC-3′) for TEF1-α, TubF1 (5′-ATG CGT GAG ATT GTA CGT AT-3′)/TubR1 (5′-GTACCAATGCAAGAAAGCCT-3′) for β-tubulin, and colaexon3-fwd (5′-TTT ACC TTA CGG TCA AAT GAG CCT-3′)/colaexon4-rev (5′-AAC TCA ACA ATA TCA CCT CCA ATT CAT-3′) for cytB (Fischer et al., 2017; Hily et al., 2011; Poniatowska et al., 2021; White et al., 1990). The sequence analysis was conducted by Cosmogentech (Seoul, Korea), and the obtained sequences were identified using the NCBI nucleotide blast search program.

Amplified fragment length polymorphism (AFLP)

EcoRI (10 unit) and MspI (10 unit) were used to digest 200 ng of genomic DNA in a 20 μl reaction at 37°C for 5 h. The digested DNA was ligated to EcoRI adapter (0.1 μM: 5′-GACGATGAGTCCTGAT-3′, 5′-CGATCAGGACTCATC-3′) and MspI adapter (0.1 μM: 5′-GACGATGAGTCCTGAG-3′, 5′-CGCTCAGGACTCAT-3′) using 40 units of T4 DNA ligase, and 0.2 mM ATP in a 50 μl reaction at 37°C for 3 h. Following a 20-fold dilution of the ligated product, nonselective amplification was carried out using EcoRI+0 (5′-GACTGCGTACCAATTC-3′) and MspI+0 (5′-GATGAGTCCTGAGCGG-3′) primers. The thermal conditions included pre-denaturation at 94°C for 2 min, 20 amplification cycles (94°C for 30 s, 56°C for 1 min, and 72°C for 1 min), and final extension at 72°C for 90 s. The PCR products from the pre-amplification step were diluted 10-fold, and 1 μl of the dilution was used for selective amplification with the same core primers as the first amplification, along with two arbitrary (selective) nucleotides at the 3′ end. Selective reactions were performed in a 20 μl PCR reaction mix with the same components as the pre-amplification step, using 0.3 U of Taq polymerase and 50 ng of each selected primer. EcoRI primers were FAM labeled at their 5′ end for automated laser fluorescence analysis. The reaction involved an initial touch-down protocol: 12 cycles of primer-sensitive amplification (94°C for 30 s, 65°C decreased by 0.7°C during each cycle for 30 s, and 72°C for 60 s), 23 normal cycles (94°C for 30 s, 56°C for 30 s, and 72°C for 60 s), and a final elongation at 72°C for 10 min. The FAM-labeled amplicon was analyzed using a DNA Analyzer ABI3730XL (Perkin Elmer, Waltham, MA, USA) at the National Instrumentation Center for Environmental Management. From an initial screening of 40 different primer combinations on the fungal isolates, 20 primer combinations (comprising 4 EcoRI [E] and 10 MspI [M] primers) were selected based on amplification profile intensity, number of bands, and indicative polymorphism. M-TA, M-GT, M-TC, M-CT, M-TG, and M-AG were combined with E-GA; E-GA was combined with M-CG, M-CT, M-AT, M-TA, M-AG, M-TC, and M-GT; E-GT was combined with M-CG, M-GA, and M-GC; and E-TC was combined with M-TA, M-GA, M-AG, and M-CG (Gril et al., 2010).

Statistical analysis

The FAM-labeled DNA fragments generated from the DNA analyzer were obtained as fragment analysis (FSA) files. Fragment information within the FSA files was managed using the Fragman package (version 1.0.9) and analyzed with stats (version 4.3.2), ape (analysis of phylogenetic and evolution, version 5.7.1), nortest (version 1.0.4), vegan (version 2.6.4), and pairwiseAdonis (version 0.4.1) package in R (version 4.3.2). AFLP was evaluated based on sensitivity, geographical separation, and host plant for previously studied fungicides including bitertanol, pyraclostrobin, procymidone, and fluxapyroxad. The reported raw measurements involved the calculation of half-maximal effective concentration (EC50) for fungicides using a three or four-parameter log-logistic model in the drc package (version 3.0.1) in R. The log-logistic model and EC50 results were included in the supplementary data (data not shown). The results were visualized using ggplot2 (version 3.4.2) and ggpubr (version 0.6.0) packages in R.

Results and Discussion

Phylogenetic analysis of M. fructicola isolates nationwide

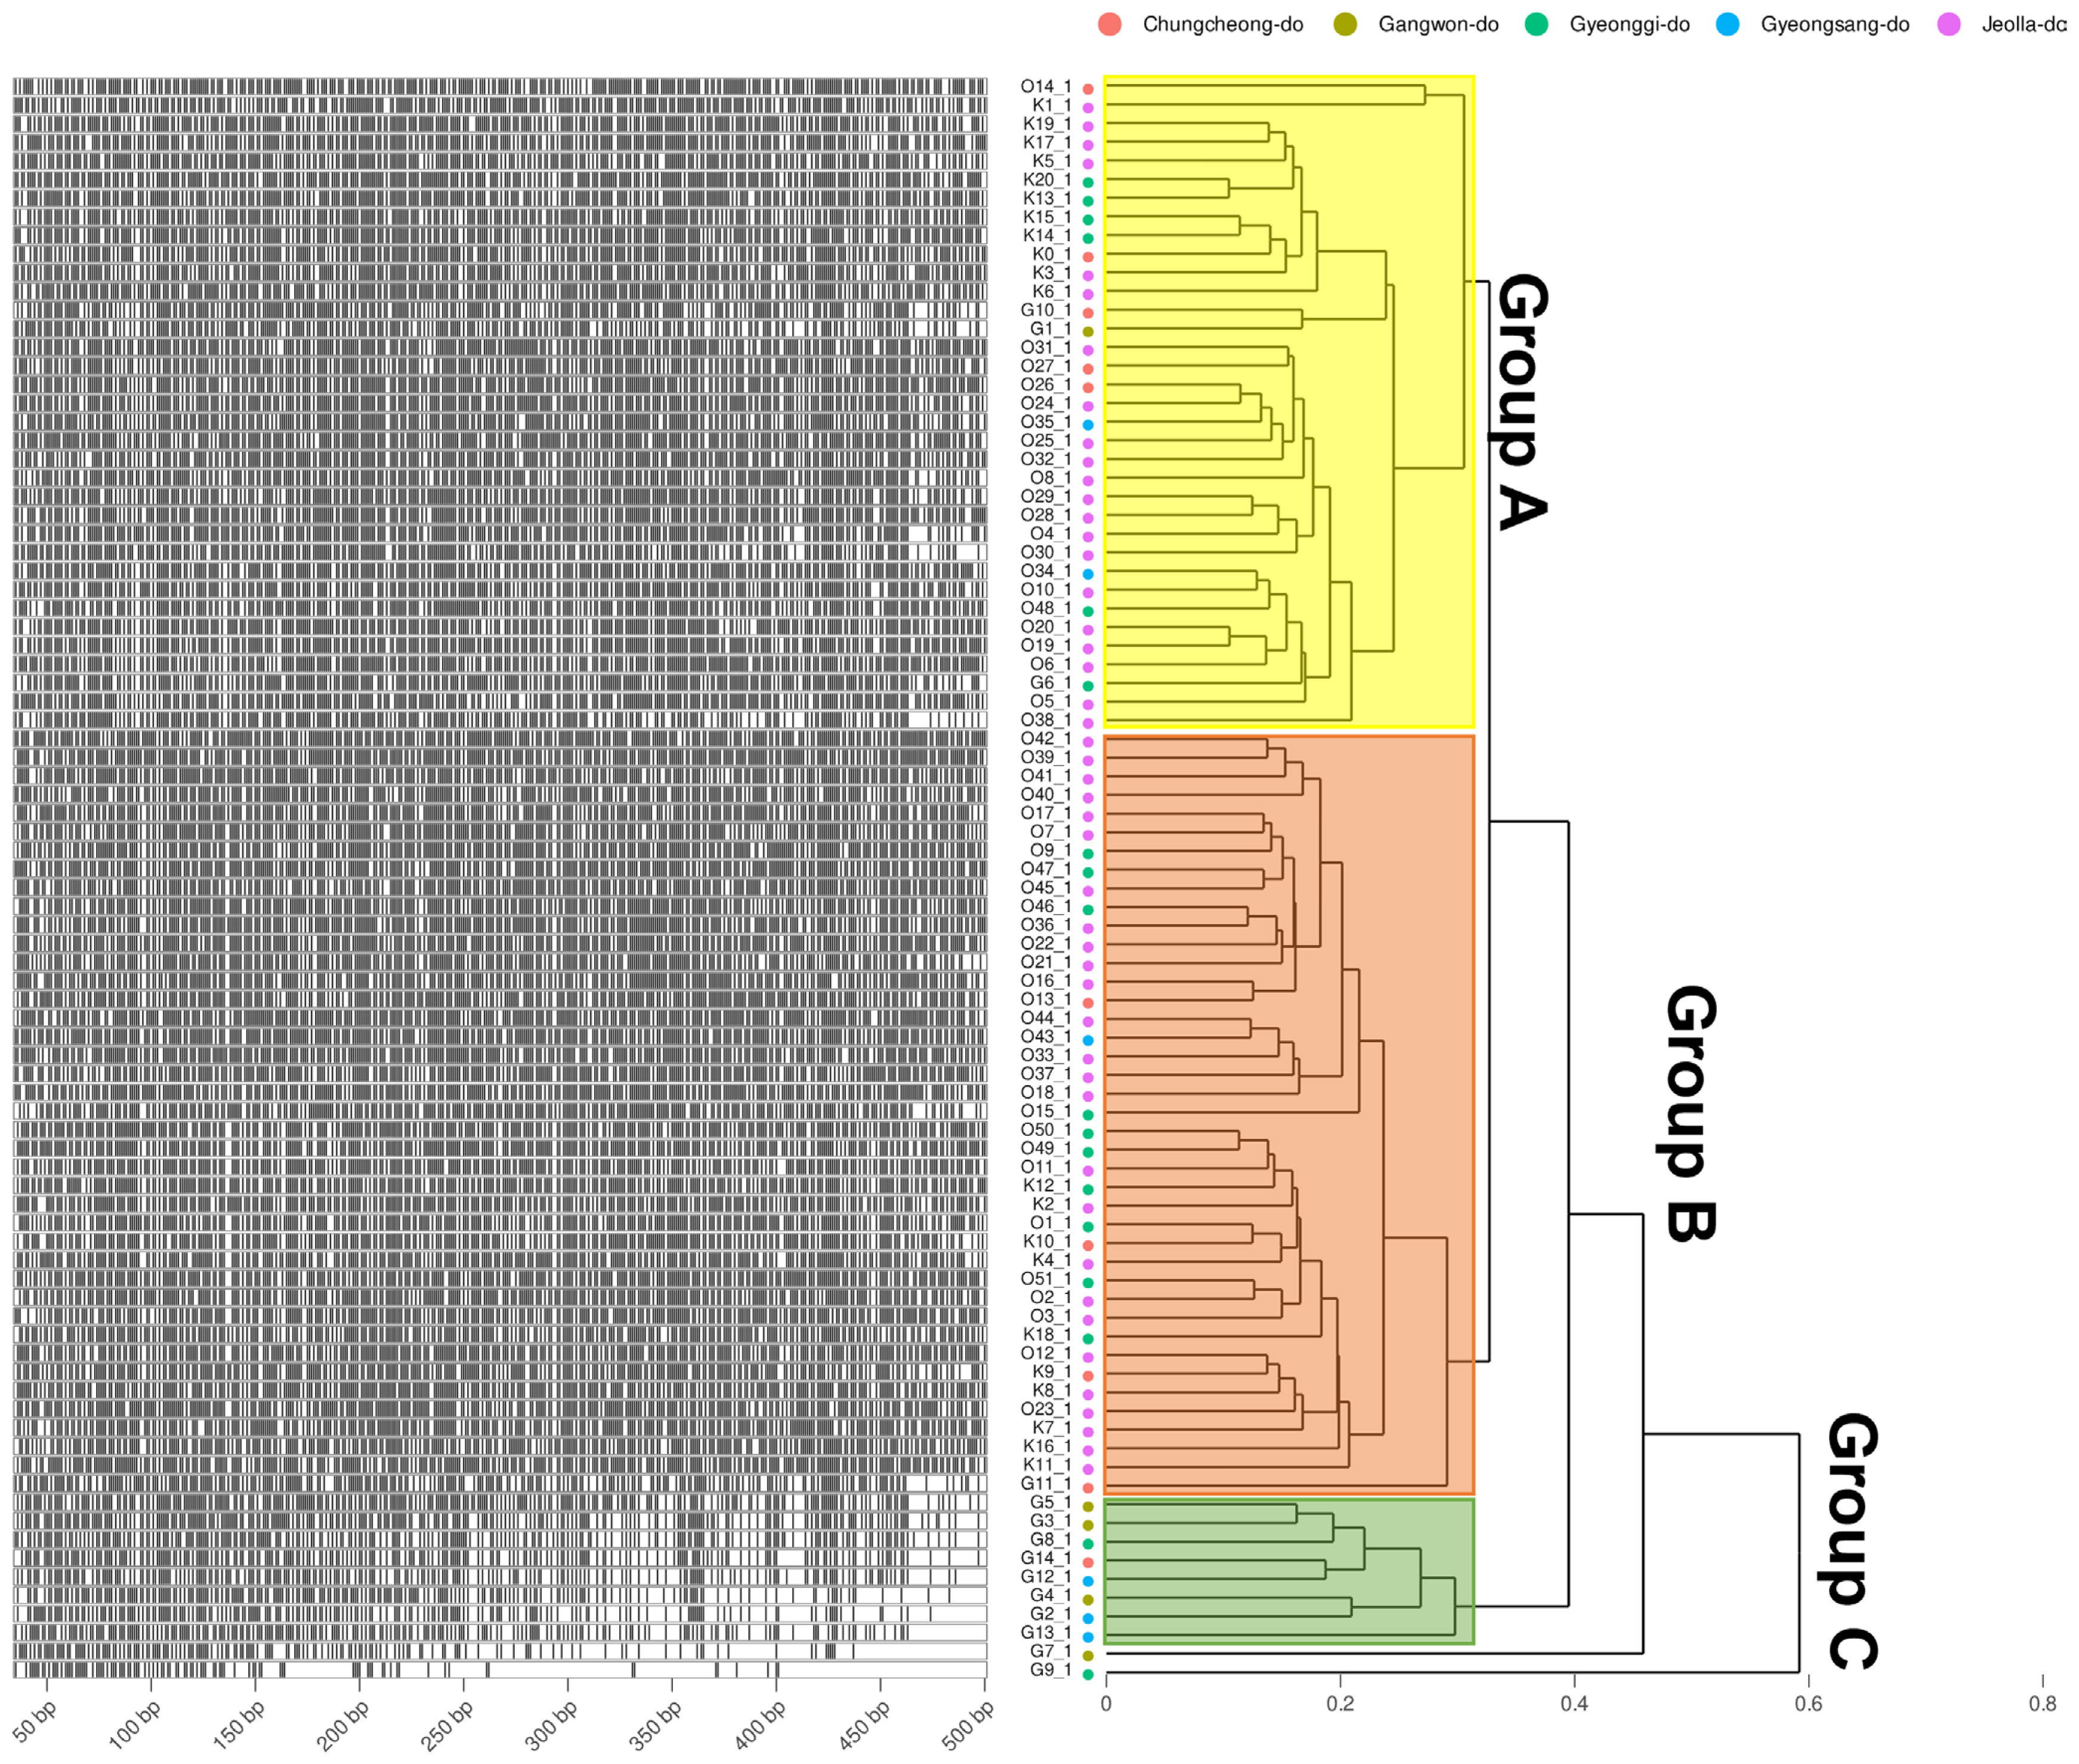
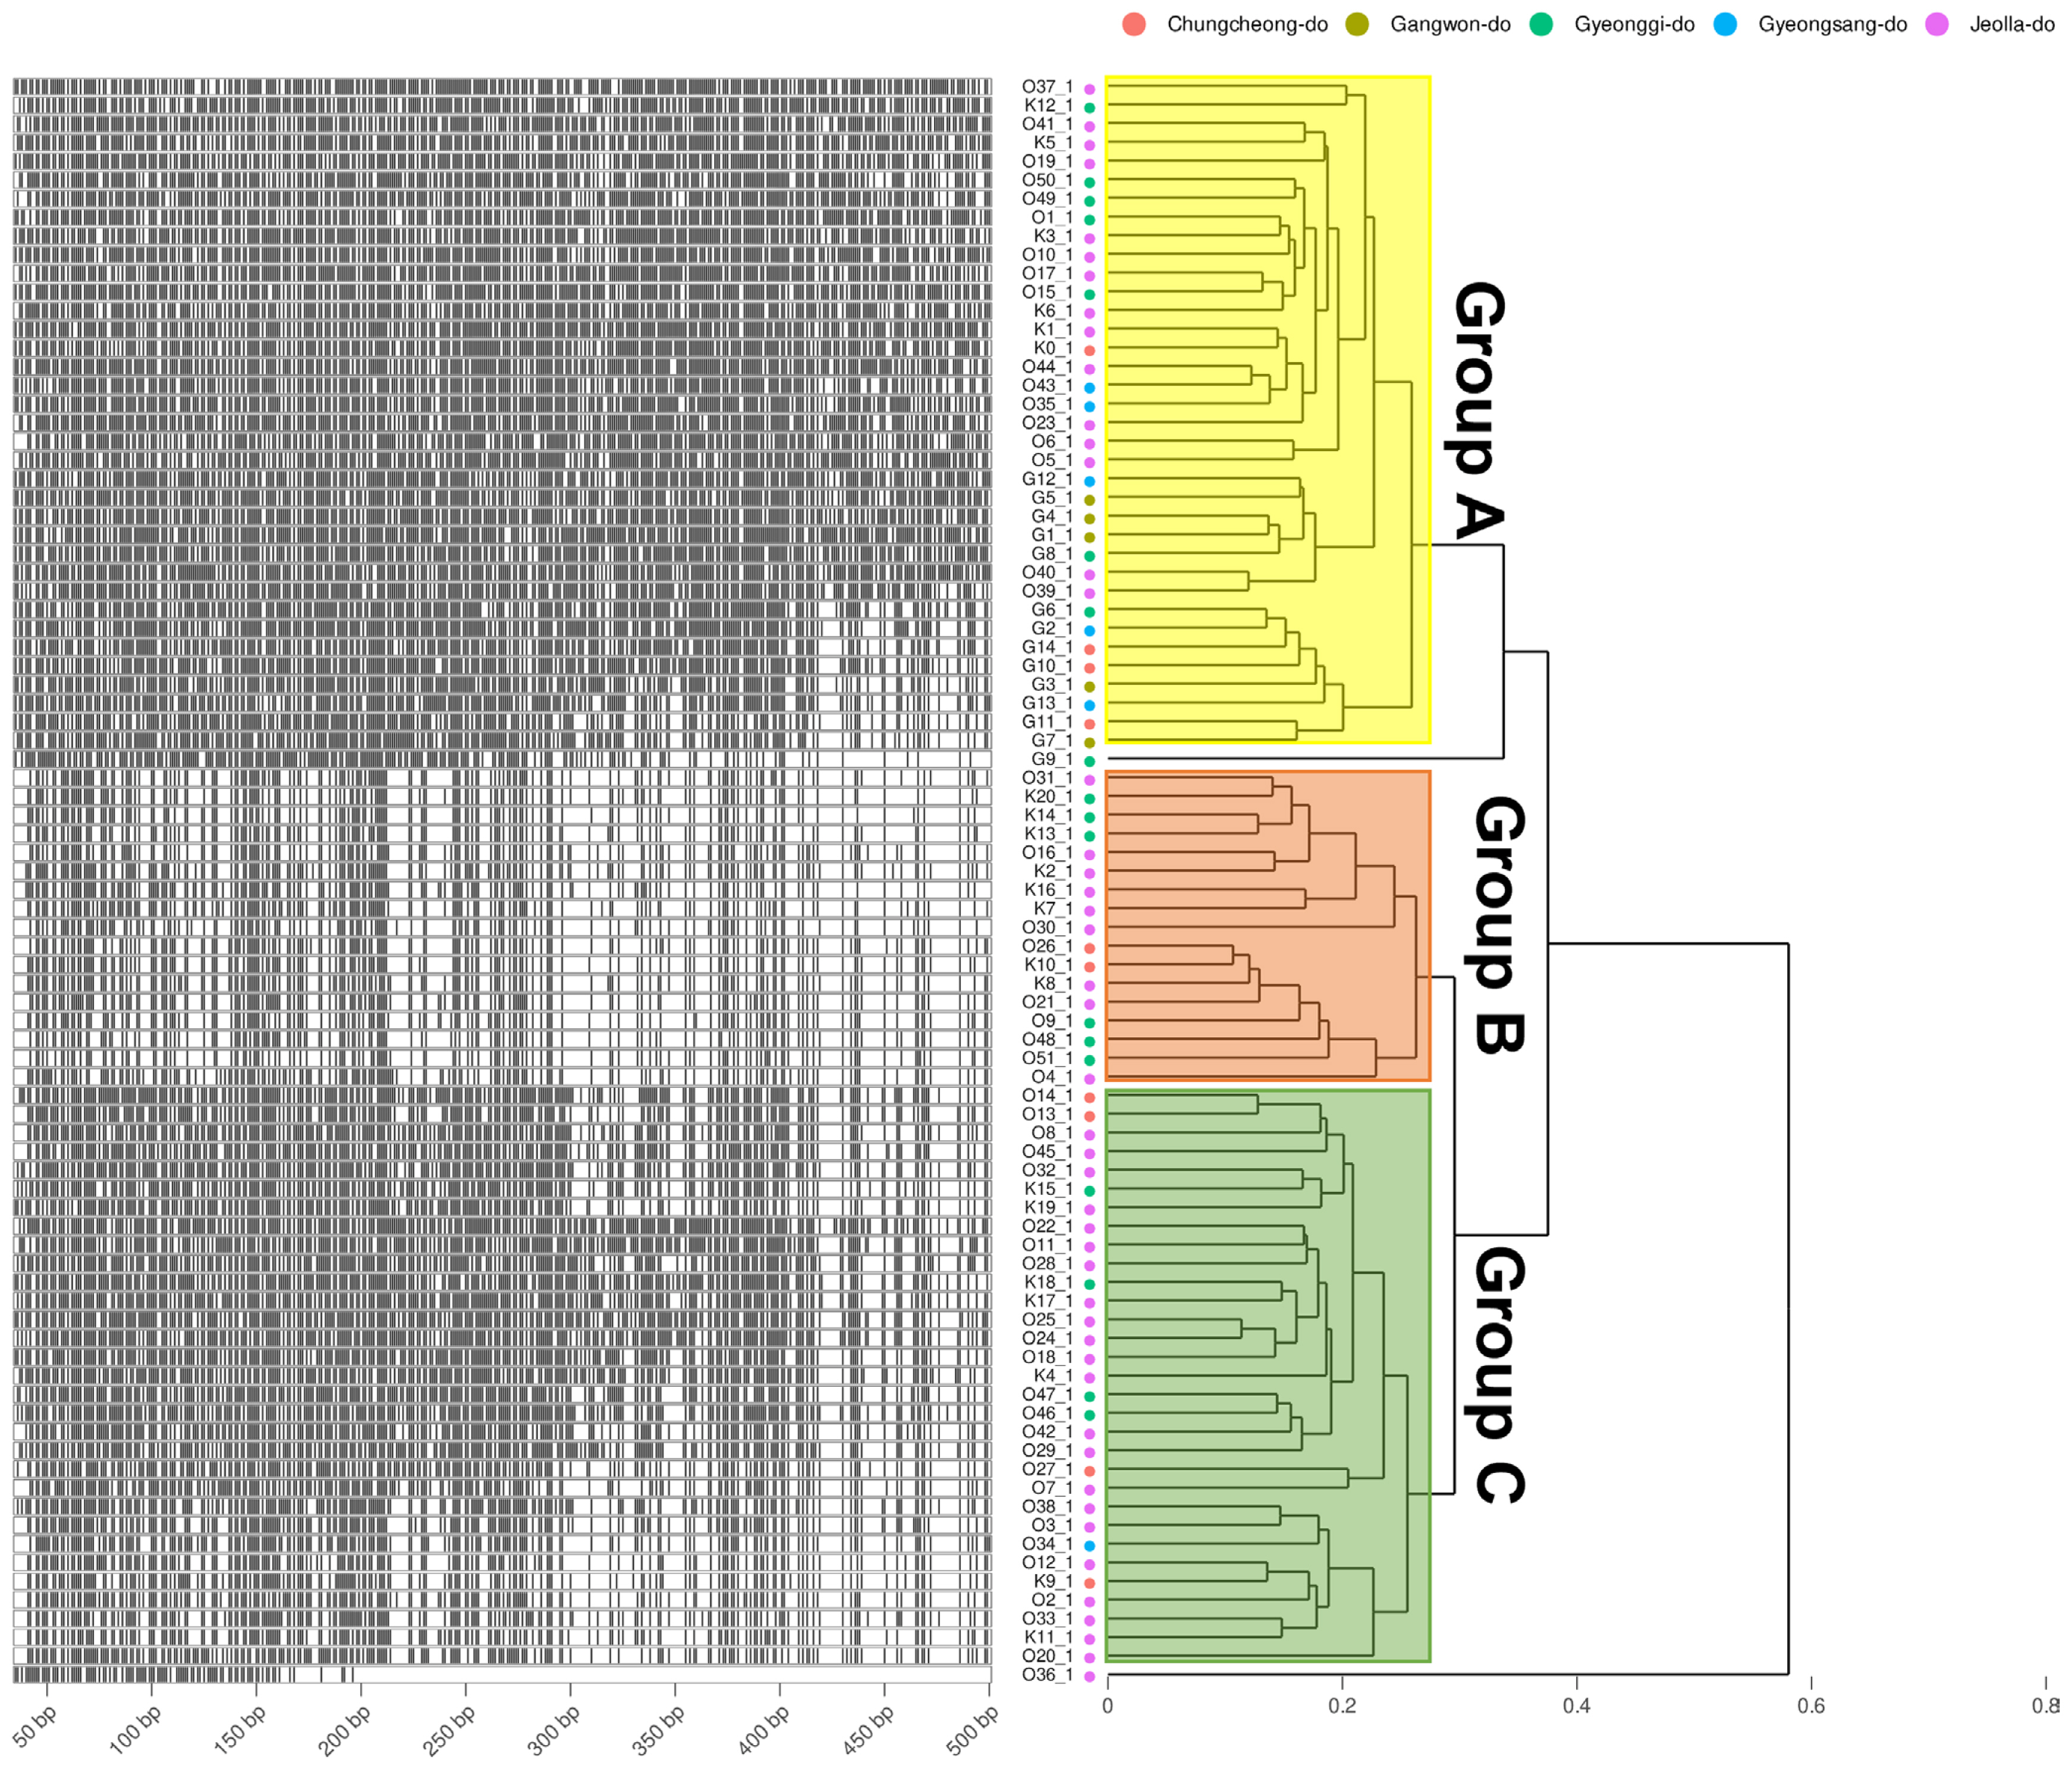
To obtain information based on pathogen variation, this study was designed to investigate genetic diversity using 86 of the pathogens isolated from stone fruit cultivation in Korea (Fig. 1) and examine the relationship between AFLP and strain characteristics. As a result, a total of 1,482 well-defined AFLP bands were amplified. Primer combination E-GA+ M-CG, M-CT, M-AT, M-TA, M-AG, M-TC, and M-GT amplified the highest number of fragments (379). On the other hand, the primer combination E-GT+ M-CG, M-GA, and M-GC showed the fewest bands (28). On average, 304.92 AFLP markers were amplified per primer combination in the size range of 40-500 bp. The fragment patterns were utilized to construct a phylogenetic tree using Bray-Curtis distance and the Weighted Pair Group Method with Averaging (WPGMA) hierarchical clustering. All four primer combinations were grouped into three major clusters based on a phylogenetic distance of 0.3, and isolates from Jeolla province show a high frequency in all clusters (Figs. 2 and 3). In particular, distinct patterns were observed between strains isolated from Jeolla province and those from other regions, especially with the primer combinations E-GA+M-CG, M-CT, M-AT, M-TA, M-AG, M-TC, M-GT (Fig. 2), and E-TC+M-TA, M-GA, M-AG, G-CG (Fig. 3). Furthermore, when comparing AFLP banding patterns obtained from an AFLP study on M. laxa, a causative agent of brown rot disease, previously reported by Gril et al. (2008), completely different electrophoretic profiles were observed. This suggests that the AFLP technique is a suitable tool for studying closely related groups of brown rot pathogens.

PCoA of M. fructicola populations

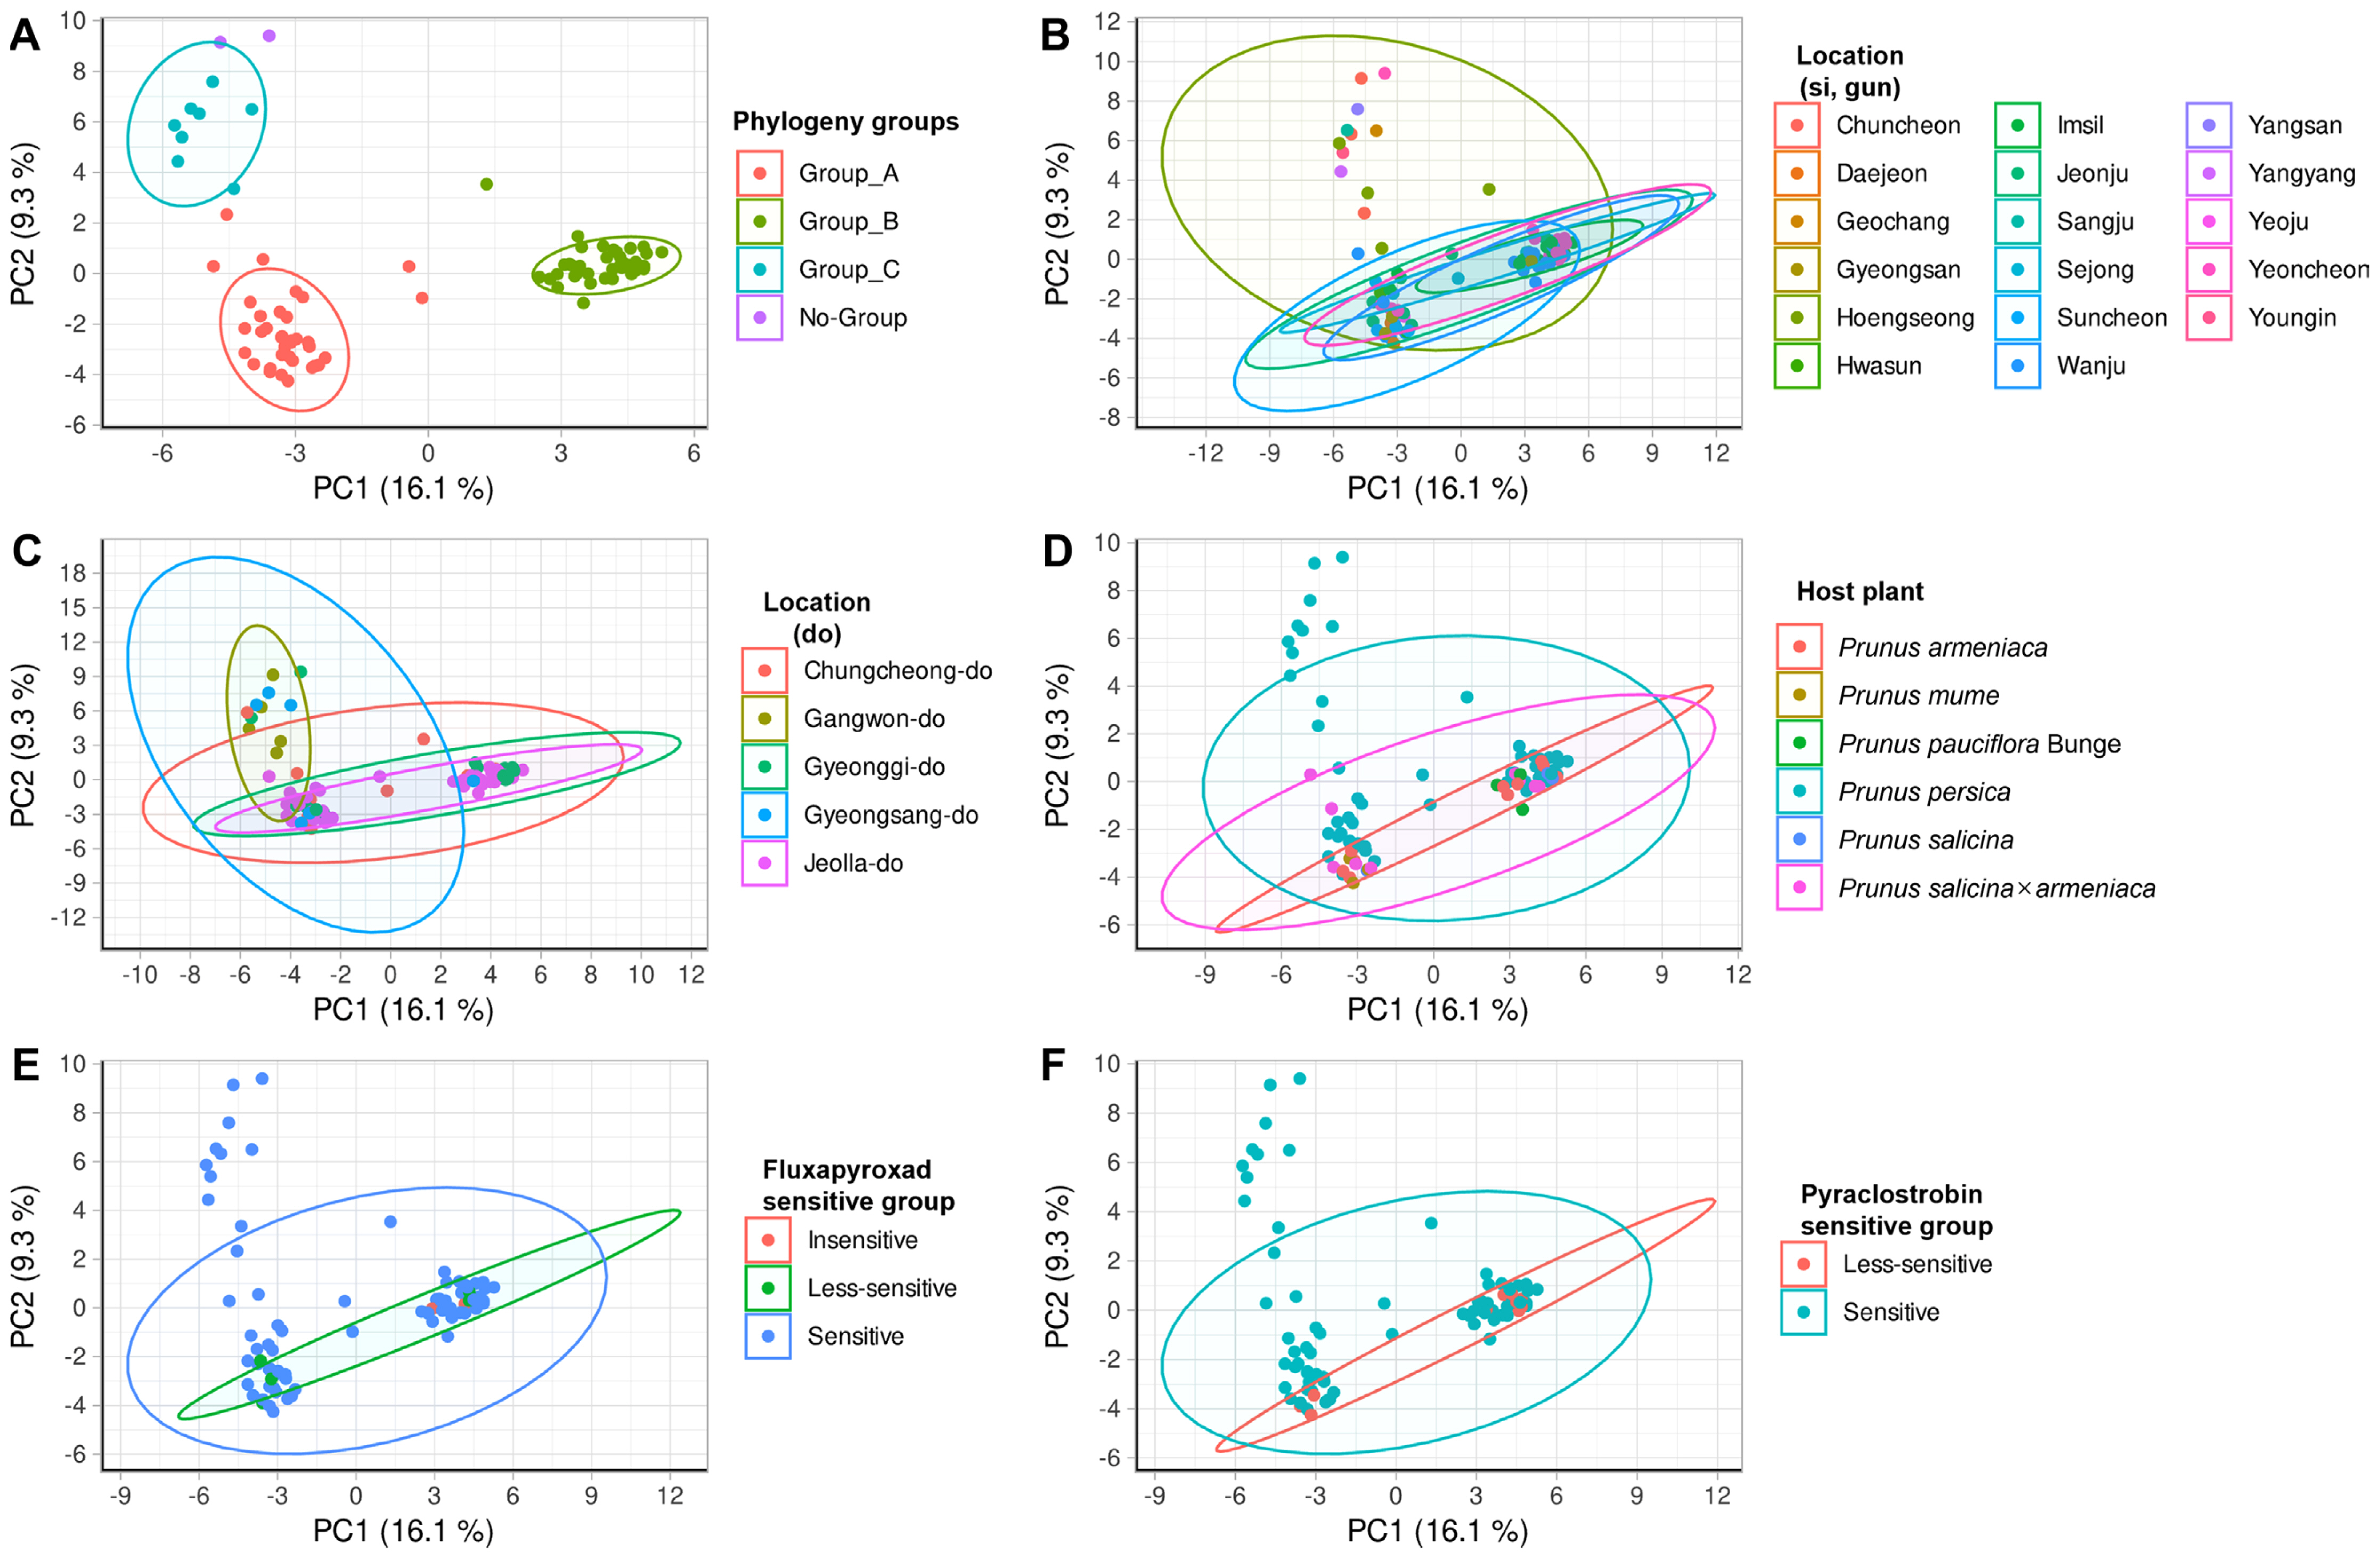
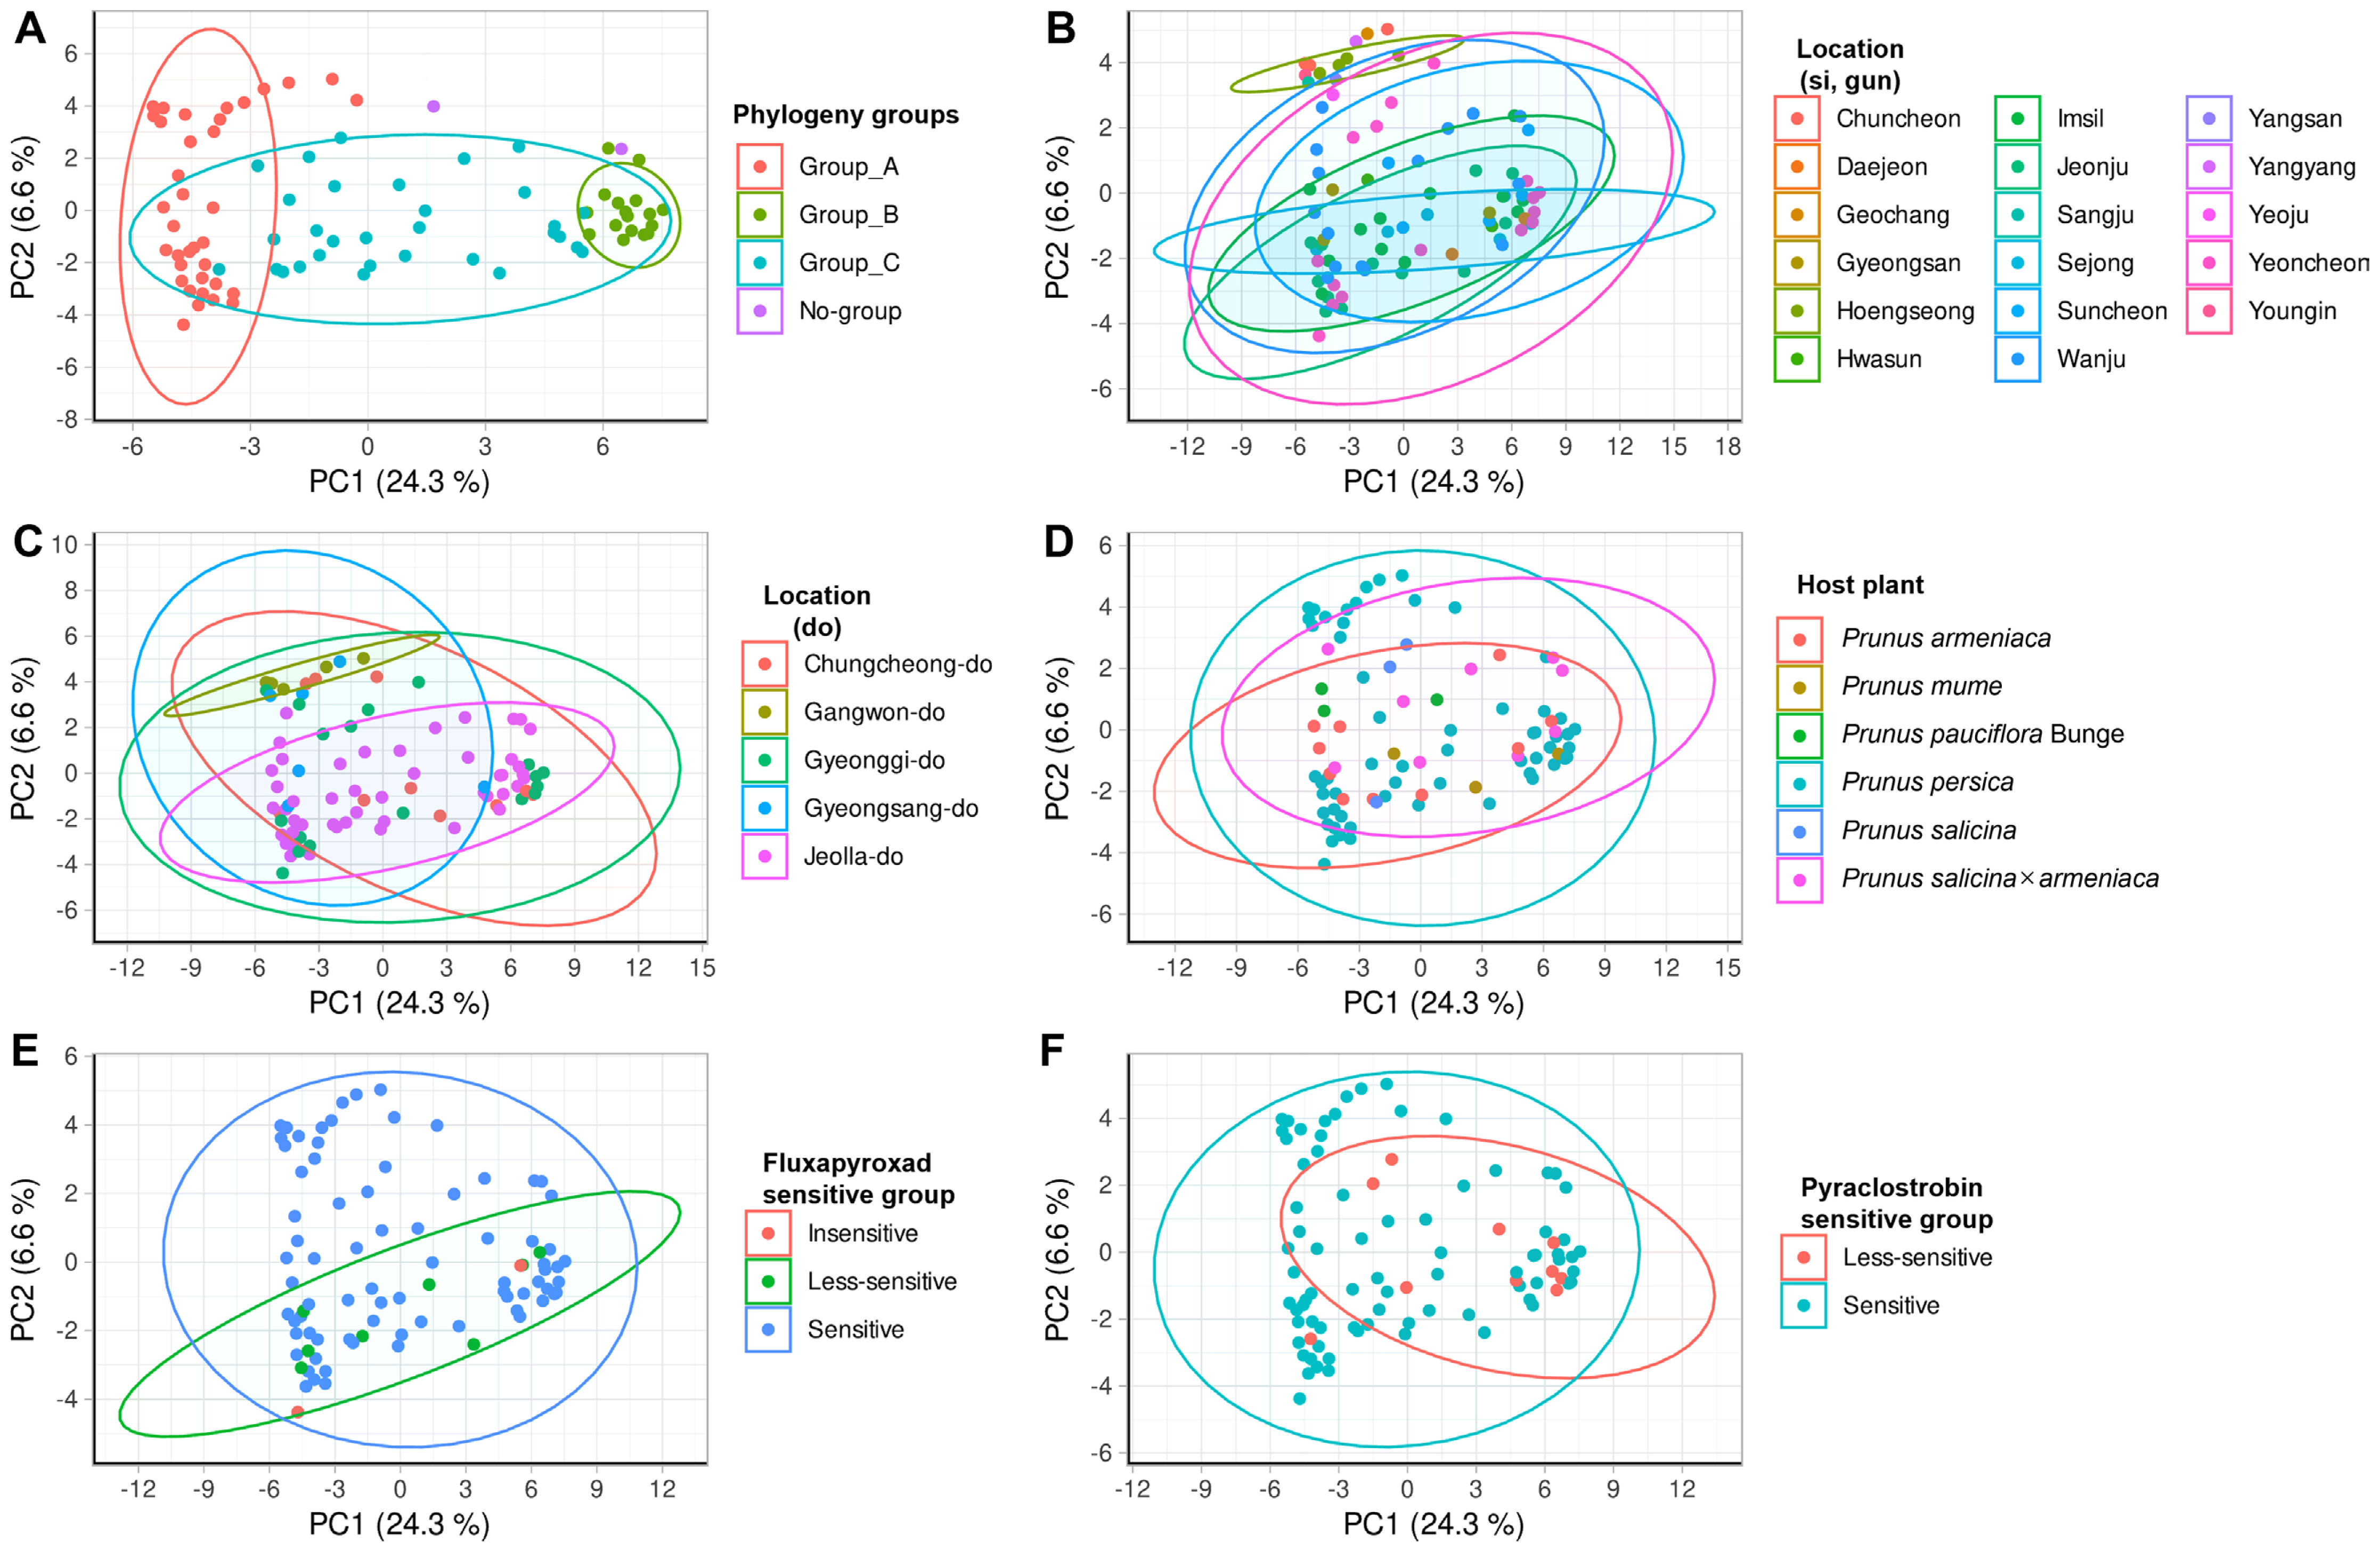
In order to analyze the relationship more thoroughly between AFLP analysis and characteristics, we conducted a dimensional analysis using PCoA on primer combinations E-GA+M-CG, M-CT, M-AT, M-TA, M-AG, M-TC, M-GT, and E-TC+M-TA, M-GA, M-AG, G-CG pattern combinations (Figs. 4 and 5). Then PERANOVA observed whether the distribution of the pattern of the fragment varies by characteristic (Tables 2 and 3, Figs. 4 and 5). For the category of fungicides EC50 were based on their quartiles (data not shown). Subsequently, PERMANOVA and pairwise PERMANOVA results (Tables 2 and 3), calculated based on point distribution, indicated significant differences in distribution (PERMANOVA, P < 0.10; pairwise PERMANOVA, Padj < 0.10) at the large-scale locational unit (province). The results from Tables 2 and 3 diverge from the findings of the AFLP pattern analysis. While the AFLP pattern analysis indicates a difference between Jeolla province and other regions, the results from Tables 2 and 3 suggest a significant difference between Gangwon province and other regions. Moreover, significant distribution differences were identified among groups within the AFLP phylogeny (PERMANOVA, P < 0.001; pairwise PERMANOVA, Padj < 0.001). However, no significant differences were observed between host plants and fungicide resistance groups (Figs. 4 and 5). In previous studies, isolates from diverse geographical locations (Spain, New Zealand, and Japan) from the same hosts were clustered, also suggesting a potential correlation with host specificity (Gril et al., 2010). Additionally, in another study, strains isolated from Virginia and Washington in the United States, though geographically separated, were considered to share a common origin based on being collected from the same host plant (Fulton et al., 1999). This suggests that, despite the diversity of host plants in Korea, significant differences occurred depending on the geographical separation.
This study investigated the genetic differentiation of M. fructicola, examining its influence based on cultivation regions, host plants, fungicide usage, and various environmental conditions. Different patterns were observed depending on the region, and significant differences were identified. However, the number of fungicide-resistant strains was limited. This highlights the need for further research, diverse approaches, and genetic diversity monitoring for sustainable agriculture.

Notes

Conflicts of Interest

No potential conflict of interest relevant to this article was reported.

Acknowledgments

This research was supported by the Rural Development Administration of Korea (RS-2022-RD010350).

Fig. 1
Site information where strains are isolated. Small district unit (-si, and -gun) names of the site are described by points and large unit (-do) names are described by the colors of points. In all sites, there are a total of 16 distinct regions.
ppj-oa-01-2024-0017f1.jpg
Fig. 2
DNA fragments of amplified fragment length polymorphism and the fragment phylogeny of E-GA + M-CG, CT, AT, TA, AG, TC, GT primer combination. The Left of the plots shows the specifically amplified genomic DNA length information after the DNA fragmentation. Phylogeny on the right is calculated by the Bray-Curtis distance of the length and Weighted Pair Group Method with Averaging (WPGMA) clustering. Four different amplification profiles are shown when E-GA + M-CG, CT, AT, TA, AG, TC, and GT primer combinations were used. The group displayed by yellow, orange, and green translucent rectangles is determined based on 0.3.
ppj-oa-01-2024-0017f2.jpg
Fig. 3
DNA fragments of amplified fragment length polymorphism and the fragment phylogeny of E-TC + M-TA, GA, AG, CG primer combination. The Left of the plots shows the specifically amplified genomic DNA length information after the DNA fragmentation. Phylogeny on the right is calculated by the Bray-Curtis distance of the length and Weighted Pair Group Method with Averaging (WPGMA) clustering. Four different amplification profiles are shown when E-TC + M-TA, GA, AG, and CG primer combinations were used. The group displayed by yellow, orange, and green translucent rectangles is determined based on 0.3.
ppj-oa-01-2024-0017f3.jpg
Fig. 4
The genomic DNA fragment principal coordinate analysis results of E-GA + M-CG, CT, AT, TA, AG, TC, GT primer combination. Point meaning each Monilinia fructiocola strain is flat. The graph is organized based on amplified fragment length polymorphism (AFLP) phylogeny group, small unit location (-si, -gun), large unit location (-do), host plant, fluxapyroxad sensitive group, pyraclostrobin sensitive group, and the ellipses represent the extent to which 95% of points are distributed. (A) AFLP phylogeny group. (B) Small unit location group. (C) Large unit location group. (D) Host plant groups. (E) Fluxapyroxad sensitive group. (F) Pyraclostrobin sensitive group. Phylogeny groups (except for no group), PERMANOVA, P = 1e-05, Location (-do), PERMANOVA, P = 7e-05.
ppj-oa-01-2024-0017f4.jpg
Fig. 5
The genomic DNA fragment principal coordinate analysis results of E-TC + M-TA, GA, AG, CG primer combination. Point meaning each Monilinia fructiocola strain is flat. The graph is organized based on amplified fragment length polymorphism (AFLP) phylogeny group, small unit location (-si, -gun), large unit location (-do), host plant, fluxapyroxad sensitive group, pyraclostrobin sensitive group, and the ellipses represent the extent to which 95% of points are distributed. (A) AFLP phylogeny group. (B) Small unit location group. (C) Large unit location group. (D) Host plant groups. (E) Fluxapyroxad sensitive group. (F) Pyraclostrobin sensitive group. Phylogeny groups (except for no group), PERMANOVA, P = 1e-05, Location (-do), PERMANOVA, P = 7e-05.
ppj-oa-01-2024-0017f5.jpg
Table 1
Monilinia fructicola isolates information
Strain Sampling location Host plant Bitertanol group Fluxapyroxad group Procymidone group Pyraclostrobin group

Large unit location name (-do) Small unit location name (-si, -gun)
G1 Gangwon-do Chuncheon Prunus persica Sensitive Sensitive Sensitive Sensitive
G2 Gyeongsang-do Yangsan Prunus persica Sensitive Sensitive Sensitive Sensitive
G3 Gangwon-do Yangyang Prunus persica Sensitive Sensitive Sensitive Sensitive
G4 Gangwon-do Chuncheon Prunus persica Sensitive Sensitive Sensitive Sensitive
G5 Gangwon-do Hoengseong Prunus persica Sensitive Sensitive Sensitive Sensitive
G6 Gyeonggi-do Yeoju Prunus persica Sensitive Sensitive Sensitive Sensitive
G7 Gangwon-do Chuncheon Prunus persica Sensitive Sensitive Sensitive Sensitive
G8 Gyeonggi-do Youngin Prunus persica Sensitive Sensitive Sensitive Sensitive
G9 Gyeonggi-do Yeoncheon Prunus persica Sensitive Sensitive Sensitive Sensitive
G10 Chungcheong-do Hoengseong Prunus persica Sensitive Sensitive Sensitive Sensitive
G11 Chungcheong-do Hoengseong Prunus persica Sensitive Sensitive Sensitive Sensitive
G12 Gyeongsang-do Sangju Prunus persica Sensitive Sensitive Sensitive Sensitive
G13 Gyeongsang-do Geochang Prunus persica Sensitive Sensitive Sensitive Sensitive
G14 Chungcheong-do Hoengseong Prunus persica Sensitive Sensitive Sensitive Sensitive
K0 Chungcheong-do Sejong Prunus persica Sensitive Sensitive Sensitive Sensitive
K1 Jeolla-do Jeonju Prunus persica Sensitive Sensitive Sensitive Sensitive
K2 Jeolla-do Jeonju Prunus persica Sensitive Sensitive Sensitive Sensitive
K3 Jeolla-do Jeonju Prunus persica Sensitive Sensitive Sensitive Sensitive
K4 Jeolla-do Jeonju Prunus persica Sensitive Less-sensitive Sensitive Sensitive
K5 Jeolla-do Jeonju Prunus persica Sensitive Sensitive Sensitive Sensitive
K6 Jeolla-do Imsil Prunus persica Sensitive Sensitive Sensitive Sensitive
K7 Jeolla-do Imsil Prunus persica Sensitive Sensitive Sensitive Sensitive
K8 Jeolla-do Imsil Prunus persica Sensitive Sensitive Sensitive Sensitive
K9 Chungcheong-do Sejong Prunus persica Sensitive Sensitive Sensitive Sensitive
K10 Chungcheong-do Sejong Prunus persica Sensitive Sensitive Sensitive Sensitive
K11 Jeolla-do Wanju Prunus persica Sensitive Sensitive Sensitive Sensitive
K12 Gyeonggi-do Yeoncheon Prunus persica Sensitive Sensitive Sensitive Sensitive
K13 Gyeonggi-do Yeoncheon Prunus persica Sensitive Sensitive Sensitive Sensitive
K14 Gyeonggi-do Yeoncheon Prunus persica Sensitive Sensitive Sensitive Sensitive
K15 Gyeonggi-do Yeoncheon Prunus persica Sensitive Sensitive Sensitive Sensitive
K16 Jeolla-do Jeonju Prunus persica Sensitive Sensitive Sensitive Sensitive
K17 Jeolla-do Hwasun Prunus persica Sensitive Sensitive Sensitive Sensitive
K18 Gyeonggi-do Yeoncheon Prunus persica Sensitive Sensitive Sensitive Sensitive
K19 Jeolla-do Imsil Prunus persica Sensitive Sensitive Sensitive Sensitive
K20 Gyeonggi-do Yeoncheon Prunus persica Sensitive Sensitive Sensitive Sensitive
O1 Gyeonggi-do Yeoncheon Prunus persica Sensitive Insensitive Sensitive Sensitive
O2 Jeolla-do Hwasun Prunus persica Sensitive Sensitive Sensitive Sensitive
O3 Jeolla-do Jeonju Prunus persica Sensitive Sensitive Sensitive Less-sensitive
O4 Jeolla-do Wanju Prunus persica Sensitive Less-sensitive Sensitive Sensitive
O5 Jeolla-do Jeonju Prunus persica Sensitive Sensitive Sensitive Sensitive
O6 Jeolla-do Jeonju Prunus persica Sensitive Sensitive Sensitive Sensitive
O7 Jeolla-do Jeonju Prunus persica Sensitive Less-sensitive Sensitive Sensitive
O8 Jeolla-do Jeonju Prunus persica Sensitive Sensitive Sensitive Sensitive
O9 Gyeonggi-do Yeoncheon Prunus persica Sensitive Sensitive Sensitive Less-sensitive
O10 Jeolla-do Jeonju Prunus persica Sensitive Sensitive Sensitive Sensitive
O11 Jeolla-do Imsil Prunus persica Sensitive Sensitive Sensitive Sensitive
O12 Jeolla-do Imsil Prunus persica Sensitive Insensitive Sensitive Sensitive
O13 Chungcheong-do Sejong Prunus persica Sensitive Less-sensitive Sensitive Sensitive
O14 Chungcheong-do Sejong Prunus persica Sensitive Sensitive Sensitive Sensitive
O15 Gyeonggi-do Yeoncheon Prunus persica Sensitive Sensitive Sensitive Sensitive
O16 Jeolla-do Imsil Prunus persica Sensitive Sensitive Sensitive Less-sensitive
O17 Jeolla-do Imsil Prunus persica Sensitive Less-sensitive Sensitive Sensitive
O18 Jeolla-do Imsil Prunus persica Sensitive Sensitive Sensitive Sensitive
O19 Jeolla-do Wanju Prunus persica Sensitive Less-sensitive Sensitive Less-sensitive
O20 Jeolla-do Wanju Prunus armeniaca Sensitive Sensitive Sensitive Sensitive
O21 Jeolla-do Wanju Prunus armeniaca Sensitive Less-sensitive Sensitive Less-sensitive
O22 Jeolla-do Wanju Prunus armeniaca Sensitive Sensitive Sensitive Sensitive
O23 Jeolla-do Wanju Prunus armeniaca Sensitive Sensitive Sensitive Sensitive
O24 Jeolla-do Wanju Prunus armeniaca Sensitive Sensitive Sensitive Sensitive
O25 Jeolla-do Wanju Prunus salicina Sensitive Sensitive Sensitive Sensitive
O26 Chungcheong-do Daejeon Prunus mume Sensitive Sensitive Sensitive Less-sensitive
O27 Chungcheong-do Daejeon Prunus mume Sensitive Sensitive Sensitive Sensitive
O28 Jeolla-do Imsil Prunus mume Sensitive Sensitive Sensitive Sensitive
O29 Jeolla-do Suncheon P. salicina × armeniaca Sensitive Sensitive Sensitive Sensitive
O30 Jeolla-do Suncheon P. salicina × armeniaca Sensitive Sensitive Sensitive Sensitive
O31 Jeolla-do Suncheon P. salicina × armeniaca Sensitive Sensitive Sensitive Sensitive
O32 Jeolla-do Suncheon P. salicina × armeniaca Sensitive Sensitive Sensitive Less-sensitive
O33 Jeolla-do Suncheon P. salicina × armeniaca Sensitive Sensitive Sensitive Less-sensitive
O34 Gyeongsang-do Gyeongsan Prunus armeniaca Sensitive Sensitive Sensitive Sensitive
O35 Gyeongsang-do Gyeongsan Prunus armeniaca Sensitive Less-sensitive Sensitive Sensitive
O36 Jeolla-do Wanju P. salicina × armeniaca Sensitive Sensitive Sensitive Sensitive
O37 Jeolla-do Wanju P. salicina × armeniaca Sensitive Sensitive Sensitive Sensitive
O38 Jeolla-do Wanju P. salicina × armeniaca Sensitive Sensitive Sensitive Sensitive
O39 Jeolla-do Wanju P. salicina × armeniaca Sensitive Sensitive Sensitive Sensitive
O40 Jeolla-do Wanju Prunus pauciflora Bunge Sensitive Sensitive Sensitive Sensitive
O41 Jeolla-do Wanju Prunus pauciflora Bunge Sensitive Sensitive Sensitive Sensitive
O42 Jeolla-do Wanju Prunus pauciflora Bunge Sensitive Sensitive Sensitive Sensitive
O43 Gyeongsang-do Gyeongsan Prunus armeniaca Sensitive Sensitive Sensitive Sensitive
O44 Jeolla-do Imsil Prunus armeniaca Sensitive Sensitive Sensitive Sensitive
O45 Jeolla-do Imsil Prunus armeniaca Sensitive Sensitive Sensitive Sensitive
O46 Gyeonggi-do Yeoncheon Prunus salicina Sensitive Sensitive Sensitive Less-sensitive
O47 Gyeonggi-do Yeoncheon Prunus salicina Sensitive Sensitive Sensitive Less-sensitive
O48 Gyeonggi-do Yeoncheon Prunus persica Sensitive Sensitive Sensitive Sensitive
O49 Gyeonggi-do Yeoncheon Prunus persica Sensitive Sensitive Sensitive Sensitive
O50 Gyeonggi-do Yeoncheon Prunus persica Sensitive Sensitive Sensitive Sensitive
O51 Gyeonggi-do Yeoncheon Prunus persica Sensitive Sensitive Sensitive Sensitive
Table 2
PERMANOVA and paired-wised PERMANOVA with FDR method of E-GA + M-CG, CT, AT, TA, AG, TC, GT primer combination
Pairs Sums of Sqs F. Model R2 Padj (FDR) Significant
Phylogeny groups (except for no group), PERMANOVA, P = 1e-05
 Group_A vs. Group_C 493.8386 6.873331 0.1435733 0.00002 d
 Group_A vs. Group_B 109.7744 14.944039 0.1680162 0.00002 d
 Group_C vs. Group_B 770.8572 10.882368 0.1880083 0.00002 d
Location (do), PERMANOVA, P = 7e-05
 Gangwon-do vs. Gyeongsang-do 101.60000 1.1452906 0.1128889 0.29293333 -
 Gangwon-do vs. Gyeonggi-do 274.90193 3.0208828 0.1257607 0.00460000 b
 Gangwon-do vs. Chungcheong-do 198.23333 2.1643011 0.1427234 0.01447500 a
 Gangwon-do vs. Jeolla-do 356.90319 4.1990124 0.0774740 0.00010000 d
 Gyeongsang-do vs. Gyeonggi-do 156.18056 1.6388219 0.0693276 0.08366000
 Gyeongsang-do vs. Chungcheong-do 115.51250 1.1750163 0.0774310 0.29293333
 Gyeongsang-do vs. Jeolla-do 187.98715 2.1615285 0.0406597 0.00743333 b
 Gyeonggi-do vs. Chungcheong-do 85.51746 0.8933441 0.0332181 0.59420000
 Gyeonggi-do vs. Jeolla-do 95.75746 1.0873571 0.0169668 0.29293333
 Chungcheong-do vs. Jeolla-do 99.65670 1.1353368 0.0202250 0.29293333

PERMANOVA and paired-wise PERMANOVA are based on the Euclidean distance of the genomic DNA fragment number per length.

The permutation of PERANOVA and paired-wised PERANOVA is 99,999.

a: 0.05 < P ≤ 0.10, or 0.05 < Padj ≤ 0.10; b: 0.01 < P ≤ 0.05, or 0.01 < Padj ≤ 0.05; c: 0.001 < P ≤ 0.01, or 0.001 < Padj ≤ 0.01; d: P ≤ 0.001, or Padj ≤ 0.001.

FDR, false discovery rate.

Table 3
PERMANOVA and paired-wised PERMANOVA with FDR method of E-TC + M-TA, GA, AG, CG primer combination
Pairs Sums of Sqs F. Model R2 Padj (FDR) Significant
Phylogeny groups (except for no group), PERMANOVA, P = 1e-05
 Group_A vs. Group_B 1354.1749 21.372130 0.2953089 0.00002 d
 Group_A vs. Group_C 615.0574 8.767635 0.1188548 0.00002 d
 Group_B vs. Group_C 530.3135 9.732549 0.1746295 0.00002 d
Location (do), PERMANOVA, P = 7e-05
 Gangwon-do vs. Gyeongsang-do 89.36061 1.2015021 0.1177770 0.25465714
 Gangwon-do vs. Gyeonggi-do 202.81449 2.4096317 0.1029334 0.03773333 a
 Gangwon-do vs. Chungcheong-do 188.03333 2.5502695 0.1640016 0.03773333 a
 Gangwon-do vs. Jeolla-do 247.06268 3.0931800 0.0582595 0.00480000 b
 Gyeongsang-do vs. Gyeonggi-do 109.62500 1.2703450 0.0545907 0.25465714
 Gyeongsang-do vs. Chungcheong-do 107.40833 1.3802319 0.0897407 0.25465714
 Gyeongsang-do vs. Jeolla-do 121.85581 1.5067144 0.0286957 0.20422500
 Gyeonggi-do vs. Chungcheong-do 70.18810 0.8341848 0.0310867 0.64436667
 Gyeonggi-do vs. Jeolla-do 66.86012 0.8064997 0.0126398 0.66180000
 Chungcheong-do vs. Jeolla-do 77.07402 0.9604200 0.0171625 0.51450000

PERMANOVA and paired-wise PERMANOVA are based on the Euclidean distance of the genomic DNA fragment number per length.

Permutation of PERANOVA and paired-wised PERANOVA is 99,999.

a: 0.05 < P ≤ 0.10, or 0.05 < Padj ≤ 0.10; b: 0.01 < P ≤ 0.05, or 0.01 < Padj ≤ 0.05; c: 0.001 < P ≤ 0.01, or 0.001 < Padj ≤ 0.01; d: P ≤ 0.001, or Padj ≤ 0.001.

FDR, false discovery rate.

References

Basu, A., Ghosh, M., Meyer, R., Powell, W., Basak, S. L. and Sen, S. K. 2004. Analysis of genetic diversity in cultivated jute determined by means of SSR markers and AFLP profiling. Crop Sci. 44:678-685.
crossref pdf
Choi, I.-Y., Kim, J., Seo, K.-W., Oh, H.-T., Cho, J.-H., Kim, J.-H. and Song, Y.-J. 2016. Occurrence of brown rot on apricot caused by Monilinia fructicola in Korea. Res. Plant Dis. 22:122-126 (in Korean).
crossref
Côté, M.-J., Tardif, M.-C. and Meldrum, A. J. 2004. Identification of Monilinia fructigena, M. fructicola, M. laxa, and Monilia polystroma on inoculated and naturally infected fruit using multiplex PCR. Plant Dis. 88:1219-1225.
crossref pmid
De Miccolis Angelini, R. M., Abate, D., Rotolo, C., Gerin, D., Pollastro, S. and Faretra, F. 2018. De novo assembly and comparative transcriptome analysis of Monilinia fructicola, Monilinia laxa and Monilinia fructigena, the causal agents of brown rot on stone fruits. BMC Genomics 19:436.
pmid pmc
Fischer, J. M. M., Savi, D. C., Aluizio, R., May De Mio, L. L. and Glienke, C. 2017. Characterization of Monilinia species associated with brown rot in stone fruit in Brazil. Plant Pathol. 66:423-436.
crossref pdf
Fulton, C. E. and Brown, A. E. 1997. Use of SSU rDNA group-l intron to distinguish Monilinia fructicola from M. laxa and M. fructigena. FEMS Microbiol. Lett. 157:307-312.
pmid
Fulton, C. E., van Leeuwen, G. C. M. and Brown, A. E. 1999. Genetic variation among and within Monilinia species causing brown rot of stone and pome fruits. Eur. J. Plant Pathol. 105:495-500.
Gell, I., Cubero, J. and Melgarejo, P. 2007. Two different PCR approaches for universal diagnosis of brown rot and identification of Monilinia spp. in stone fruit trees. J. Appl. Microbiol. 103:2629-2637.
crossref pmid
Gril, T., Celar, F., Javornik, B. and Jakse, J. 2010. Fluorescent AFLP fingerprinting of Monilinia fructicola. J. Plant Dis. Prot. 117:168-172.
crossref pdf
Gril, T., Celar, F., Munda, A., Javornik, B. and Jakse, J. 2008. AFLP analysis of intraspecific variation between Monilinia laxa isolates from different hosts. Plant Dis. 92:1616-1624.
crossref pmid
Hily, J.-M., Singer, S. D., Vilani, S. M. and Cox, K. D. 2011. Characterization of the cytochrome b (cyt b) gene from Monilinia species causing brown rot of stone and pome fruit and its significance in the development of QoI resistance. Pest Manag. Sci. 67:385-396.
crossref pmid
Hrustić, J., Mihajlović, M., Grahovac, M., Delibašić, G. and Tanović, B. 2018. Fungicide sensitivity, growth rate, aggressiveness and frost hardiness of Monilinia fructicola and Monilinia laxa isolates. Eur. J. Plant Pathol. 151:389-400.
crossref pdf
Hu, M.-J., Cox, K. D., Schnabel, G. and Luo, C.-X. 2011. Monilinia species causing brown rot of peach in China. PLoS ONE 6:e24990.
crossref pmid pmc
Jones, A. L. and Ehret, G. R. 1976. Isolation and characterization of benomyl-tolerant strains of Monilinia fructicola. Plant Dis. Rep. 60:765-769.
Kim, C. H. 2000. Review of fungicide resistance problems in Korea. Korean J. Pestic. Sci. 4:1-10 (in Korean).
Kumar, P., Gupta, V. K., Misra, A. K., Modi, D. R. and Pandey, B. K. 2009. Potential of molecular markers in plant biotechnology. Plant Omics J. 2:141-162.
Lane, C. R. 2002. A synoptic key for differentiation of Monilinia fructicola, M. fructigena and M. laxa, based on examination of cultural characters. EPPO Bull. 32:489-493.
crossref pdf
Lee, S. I. and Kwak, Y.-S. 2023. Evaluation of fungicides sensitivities of peach brown rot pathogen, Monilinia fructicola. Korean J. Pestic. Sci. 27:154-162 (in Korean).
crossref
Lesniak, K. E., Peng, J., Proffer, T. J., Outwater, C. A., Eldred, L. I., Rothwell, N. L. and Sundin, G. W. 2021. Survey and genetic analysis of demethylation inhibitor fungicide resistance in Monilinia fructicola from Michigan orchards. Plant Dis. 105:958-964.
crossref pmid
Lim, T. H., Chang, T. H. and Cha, B. 1998. Incidence of benzimidazole- and dicarboximide resistant isolates of Monilinia fructicola from overwintering mummies and peduncles on peach tree. Korean J. Plant Pathol. 14:367-370 (in Korean).
Luo, C.-X. and Schnabel, G. 2008. The cytochrome P450 lanosterol 14α-demethylase gene is a demethylation inhibitor fungicide resistance determinant in Monilinia fructicola field isolates from Georgi. Appl. Environ. Microbiol. 74:359-366.
crossref pmid pmc pdf
Majer, D., Mithen, R., Lewis, B. G., Vos, P. and Oliver, R. P. 1996. The use of AFLP fingerprinting for the detection of genetic variation in fungi. Mycol. Res. 100:1107-1111.
crossref
Martini, C. and Mari, M. 2014. Monilinia fructicola, Monilinia laxa (Monilinia rot, brown rot). In: Postharvest decay: control strategies, eds. by S. Bautista-Baños, pp. 233-265. Academic Press, Waltham, MA, USA.
crossref
Oh, H.-T., Choi, I.-Y., Kim, J., Na, Y.-E., Lee, W.-H., Lee, K.-J. and Shin, H.-D. 2017. Characteristics of brown rot caused by Monilinia fructicola on stone fruit in Korea. Res. Plant Dis. 23:322-333 (in Korean).
crossref pdf
Poniatowska, A., Michalecka, M. and Puławska, J. 2021. Phylogenetic relationships and genetic diversity of Monilinia spp. isolated in Poland based on housekeeping- and pathogenicity-related gene sequence analysis. Plant Pathol. 70:1640-1650.
crossref pdf
Purwantara, A., Barrins, J. M., Cozijnsen, A. J. and Howle, B. J. 2000. Genetic diversity of isolates of the Leptosphaeria maculans species complex from Australia, Europe and North America using amplified fragment length polymorphism analysis. Mycol. Res. 104:772-781.
crossref
Rural Development Administration 2007. Monography of stone fruit cultivars. Rural Development Administration, Suwon, Korea. pp. 252.(in Korean).
Sammour, R. H., Badr, S., Mustafa, AE-Z and El-Esawi, M. 2013. Genetic variation within and among some Lactuca spp. based on karyotype analysis. Appl. Cell Biol. 2:136-143.
Schnabel, G., Bryson, P. K., Bridges, W. C. and Brannen, P. M. 2004. Reduced sensitivity in Monilinia fructicola to propiconazole in Georgia and implications for disease management. Plant Dis. 88:1000-1004.
crossref pmid
Schnieder, F., Koch, G., Jung, C. and Verreet, J.-A. 2001. Genotypic diversity of the wheat leaf blotch pathogen Mycosphaerella graminicola (anamorph) Septoria tritici in Germany. Eur. J. Plant Pathol. 107:285-290.
Shim, M. Y., Jeon, Y. J. and Kim, S. H. 2007. Characterization of a brown rot fungus isolated from dwarf flowering almond in Korea. Mycobiology 35:30-35.
crossref pmid pmc
Sztejnberg, A. and Jones, A. L. 1978. Tolerance of the brown rot fungus Monilinia fructiocola to iprodione, vinclozolin and procymidone fungicides. Phytopathol. News 12:187-188.
Usman, H. M., Tan, Q., Karim, M. M., Adnan, M., Yin, W.-X., Zhu, F.-X. and Luo, C.-X. 2021. Sensitivity of Colletotrichum fructicola and Colletotrichum siamense of peach in China to multiple classes of fungicides and characterization of pyraclostrobin resistant isolates. Plant Dis. 105:3459-3465.
crossref pmid
van Leeuwen, G. C. M., Baayen, R. P. and Jeger, M. J. 2002. Distinction of the Asiatic brown rot fungus Monilia polystroma sp. nov. from M. fructigena. Mycol. Res. 106:444-451.
crossref
Vos, P., Hogers, R., Bleeker, M., Reijans, M., van de Lee, T., Hornes, M., Frijters, A., Pot, J., Peleman, J., Kuiper, M. and Zabeau, M. 1995. AFLP: a new technique for DNA fingerprinting. Nucleic Acids Res. 23:4407-4414.
crossref pmid pmc
White, T. J., Bruns, T., Lee, S. and Taylor, J. 1990. Amplification and direct sequencing of fungal ribosomal RNA genes for phylogenetics. PCR protocols: a guide to methods and applications. M. A. Innis, D. H. Gelfand, J. J. Sninsky and T. J. White 315-322 p. Academic Press, San Diego, CA, USA.
crossref
Zhu, X. Q., Chen, X. Y., Luo, Y. and Guo, L. Y. 2005. First report of Monilinia fructicola on peach and nectarine in China. Plant Pathol. 54:575.
crossref


ABOUT
BROWSE ARTICLES
EDITORIAL POLICY
FOR CONTRIBUTORS
Editorial Office
Rm,904 (New Bldg.) The Korean Science & Technology Center 22,
Teheran-ro 7-Gil, Gangnamgu, Seoul 06130, Korea
Tel: +82-2-557-9360    Fax: +82-2-557-9361    E-mail: paper@kspp.org                

Copyright © 2024 by Korean Society of Plant Pathology.

Developed in M2PI

Close layer
prev next