Combined Effect of CO2 and Temperature on Wheat Powdery Mildew Development
Article information
Abstract
The effect of simulated climate changes by applying different temperatures and CO2 levels was investigated in the Blumeria graminis f. sp. tritici/wheat pathosystem. Healthy and inoculated plants were exposed in single phytotrons to six CO2+temperature combinations: (1) 450 ppm CO2/18–22°C (ambient CO2 and low temperature), (2) 850 ppm CO2/18–22°C (elevated CO2 and low temperature), (3) 450 ppm CO2/22–26°C (ambient CO2 and medium temperature), (4) 850 ppm CO2/22–26°C (elevated CO2 and medium temperature), (5) 450 ppm CO2/26–30°C (ambient CO2 and high temperature), and (6) 850 ppm CO2/26–30°C (elevated CO2 and high temperature). Powdery mildew disease index, fungal DNA quantity, plant death incidence, plant expression of pathogenesis-related (PR) genes, plant growth parameters, carbohydrate and chlorophyll content were evaluated. Both CO2 and temperature, and their interaction significantly influenced powdery mildew development. The most advantageous conditions for the progress of powdery mildew on wheat were low temperature and ambient CO2. High temperatures inhibited pathogen growth independent of CO2 conditions, and no typical powdery mildew symptoms were observed. Elevated CO2 did not stimulate powdery mildew development, but was detrimental for plant vitality. Similar abundance of three PR transcripts was found, and the level of their expression was different between six phytotron conditions. Real time PCR quantification of Bgt was in line with the disease index results, but this technique succeeded to detect the pathogen also in asymptomatic plants. Overall, future global warming scenarios may limit the development of powdery mildew on wheat in Mediterranean area, unless the pathogen will adapt to higher temperatures.
Common or bread wheat (Triticum aestivum L.) represents one of the most important crops widely grown throughout the world. Improvement of wheat-producing potential is of vital importance to provide a satisfactory grain production. It has been predicted that wheat production should increase by around 60% to satisfy the demands of growing world population by 2050 (Langridge, 2012).
Powdery mildew caused by Blumeria (syn. Erysiphe) graminis (DC) E.O. Speer f. sp. tritici Em. Marchal (Bgt) is one of the most important foliar disease on wheat worldwide, particularly in humid areas with a semi-continental or maritime climate (Bennett, 1984; Cowger et al., 2012). The pathogen is mainly spread through asexual and wind-diffused conidia. The sexual reproduction based on cleistothecia-containing ascospores allows the fungus to overwinter, since the asexual condia have a limited viability of around 24 h (Hacquard et al., 2013; Shi et al., 2016; Wicker et al., 2013; Zhang et al., 2005). Yield loss caused by powdery mildew ranges from 13 to 20% in winter and spring wheat, respectively (Conner et al., 2003; Griffey et al., 1993; Lackermann et al., 2011). Between 1969 and 2010 disease frequency reached the highest values in Western and Southern Europe (93%), and Central and Eastern Europe (72%) with respect to the other continents (Morgounov et al., 2012).
World climate change is primarily a result of increased emissions of greenhouse gases, predominantly carbon dioxide (CO2) mainly due to combustion of fossil fuel (Montzka et al., 2011). The effect of elevated CO2 through higher photosynthetic activity, increased crop growth, and enhanced water use efficiency, is predicted to be superior on C3 plants (e. g., wheat and rice) than on C4 plants (e. g., maize) which developed mechanisms of improved CO2 efficacy (Batley and Edwards, 2016; Thompson et al., 2017). Although there are reports of increased growth of C3 plants due to elevated CO2 (Bowes, 1993; Jongen and Jones, 1998; Prior et al., 2011), there is still limited information on how this growth might be affected when these plants are simultaneously infected by a plant pathogen.
World climate is changing also due to increases in the average daily, seasonal, and yearly temperatures. The adaptation potential is species dependent, and C3 species can generally adapt to a broad range of temperatures with a high flexibility of photosynthesis (Yamori et al., 2014). It has been predicted that global climate change will result in an increase of average temperatures by 1.1–6.4°C (best estimate between 1.8–4°C) until 2100, with respect to the period 1980–1999, depending on greenhouse gas levels and on modelling approaches, and an increase of 0.9°C has already been reached in 2012 (IPCC, 2007, 2014). Increase in temperature is known to affect growth and yield of plants as well as plant-pathogens interactions (Lione et al., 2015). An increase of 1°C in average seasonal temperature above 16°C adversely influenced grain and straw yield in wheat plants (Ju et al., 2010; Ottman et al., 2012).
Since CO2 in air is a key component for photosynthesis, elevated CO2 is predicted to stimulate growth of C3 plants sustained by an appropriate nutrient supply (Jakobsen et al., 2016; Wolfe et al., 1998). Temperature impact on plant growth is shown to be different from CO2 influence. Thus, increased temperature has a higher impact on grain yield than on vegetative growth (Hatfield and Prueger, 2015). However, the influence of CO2 and temperature on photosynthesis might be compensated by their interactive impact compared to the single factor, particularly in C3 plants (Morison and Lawlor, 1999).
Although there are few reports which record temperatures during CO2 enrichment trials, only the impact of a single environmental factor (CO2) on wheat infection by Bgt was taken in consideration during these studies (Bencze et al., 2013, 2015; Oehme et al., 2013; Te Beest et al., 2008; Thompson et al., 1993). Up to now, little is known about the influence of combined effect of CO2 and temperature on the development of wheat powdery mildew. To the best of our knowledge, there are only few reports concerning the effect of a combination of CO2 and temperature on powdery mildew in other host plants, such as zucchini and grapevine (Gilardi et al., 2017; Pugliese et al., 2010, 2012).
One of the main strategies which plants use to defend against biotic- and abiotic-stresses involves the induction of pathogenesis-related (PR) genes (Sudisha et al., 2012). PR genes are classified into 17 families, and are often used as markers of plant defense responses, particularly the PR-1 genes (van Loon et al., 2006; Mitsuhara et al., 2008; Matić et al., 2016). Pathogen infection in wheat resulted in up-regulation of many PR or defense response genes. Thus, the lm3 wheat mutant with enhanced resistance to Bgt showed the induction of PR-2, PR-3, PR-4, PR-9 and PR-10 genes upon infection by Bgt (Wang et al., 2016). Pritsch et al. (2000) reported the induction of PR-1, PR-2, PR-3, PR-4, and PR-5 genes in wheat during Fusarium graminearum infection. Farrakh et al. (2016) found the up-regulation of PR1-PR5 genes, and PR-9 and PR-10 genes as well, in wheat infected by Puccinia striiformis f. sp. tritici.
Objective of this study was to estimate the combined effect of different temperatures and CO2 levels on the Bgt/wheat pathosystem under phytotron conditions. Phytopathological parameters (disease index, plant death incidence, plant expression of PR genes, and amount of fungal DNA in the leaf tissue), plant growth (stem height and dry weight), and physiological parameters (chlorophyll and carbohydrate content) were investigated in order to predict the impact of climate changes on the development of wheat powdery mildew. Furthermore, this study might help to adapting existing strategies for efficient control of Bgt.
Materials and Methods
Plant material
Seeds of the wheat cultivar ‘Andino’ (Limagrain/Nickerson), susceptible to powdery mildew (RC Novi Sad, 2017), were sown in 5-l plastic pots filled with a sterile mixture of peat and sand (60%:40%). Ten pots (ten seeds per pot) were used for each experimental condition. The plants were grown in greenhouse at 20–22°C, until growth stage (GS) 39 (flag leaf ligule just visible; Zadoks et al., 1974). Two fungicide treatments were made during plant growth in order to prevent spontaneous powdery mildew infections before Bgt inoculation. At GS39, the plants were transferred to six environmentally controlled phytotrons.
Phytotron conditions
Wheat plants have been placed in six phytotrons (2 m width × 2 m length × 2.5 m height) with a 16 : 8 h light:dark photoperiod, applied by using two light systems (master-color CDM-TD metal halide Philips discharge lamps and TLD 18–830 Philips neon lamps). Lighting, ranging from 0 to 1200 μmol m−2 s−1 in four steps was used in order to simulate natural light conditions (Gullino et al., 2011). Ninety inoculated and ten control plants were maintained under six temperature and CO2 combinations: (1) 450 ppm CO2 + 18–22°C, (2) 850 ppm CO2 + 18–22°C, (3) 450 ppm CO2 + 22–26°C, (4) 850 ppm CO2 + 22–26°C, (5) 450 ppm CO2 + 26–30°C and (6) 850 ppm CO2 + ha26–30°C. The conditions of temperature, light and CO2 were constantly controlled. The trials were carried out three times under the same conditions.
Plant inoculation
Seven days after being transferred to the phytotrons, plants were artificially inoculated by spraying a Bgt (strain 7_2016, collection of Agroinnova, University of Torino) conidia suspension at concentration 3 × 10⁵/ml, resulting in around 20 conidia/cm2 (Randoux et al., 2006). Control plants were sprayed with distilled water.
Disease index and death incidence
The inoculated wheat plants were monitored on a daily basis for the presence of powdery mildew symptoms. The development of powdery mildew on wheat plants was measured by assessing disease index (DI) at 5 and 10 days post-inoculation (dpi). The DI was assessed by using a 0–9 scale where 0 corresponds to absence of disease symptoms, and 9 to severe disease (Saari and Prescott, 1975), and it was calculated using the following formula:
where n0, n1. . .. . .n9 correspond to the number of plants with disease scores of 0, 1 ... 9, respectively (Cao et al., 2015). Death incidence was evaluated as the percentage of dead plants at 20 dpi.
Plant growth parameters
The plant aboveground height (cm) and total dry weight (g) were determined on Bgtinoculated and control wheat plants for each phytotron condition at 10 dpi, including three randomly selected plants per pot. The plant dry weight (drying in a forced air oven at 70°C for 48 h) was measured by an analytical balance.
Leaf chlorophyll content
The chlorophyll content index (CCI) for six simulated climate conditions was assessed on three leaves (three replicates per leaf) of the infected and control plants (9 and 3 randomly selected plants, respectively). CCI was measured at 10 dpi by the CCM-200 plus Chlorophyll Content Meter (Opti-Sciences Inc., Hudson, NY, USA), which emits red light (653 nm, chlorophyll) and near-infrared light (931 nm) on the upper leaf surface and measures the leaf transmittance.
Total carbohydrate assay
To determine the total carbohydrate content in wheat leaves the phenol-sulfuric acid method was used (Nielsen, 2010). Leaf samples (50 mg) of inoculated and control plants at 10 dpi were homogenized in 200 μl of assay buffer and centrifuged at 13,000 × g for 5 min. The supernatant obtained was used for measuring the entire carbohydrate fractions using the Total Carbohydrate Assay Kit (Sigma-Aldrich, Milan, Italy). D-glucose (2 mg/ml) was used as a standard for calibration. Data were represented as mg of carbohydrate per g fresh weight (FW) of leaf tissue.
DNA extraction
DNA of Bgt was extracted with an E.Z.N.A.® Fungal DNA Mini Kit (Omega Bio-Tek, Darmstadt, Germany) using 0.1 g of wheat leaves containing powdery-mildew pustules (where visible) at 10 dpi, according to the manufacturer’s instructions. The concentration and quality of DNA were measured by using a NanoDrop 2000 Spectrophotometer (Thermo Scientific, Wilmington, DE, USA), and DNA was serially diluted till concentration of 2.5 ng per μl.
Quantification of Bgt by real time PCR
The real time PCR assay for Bgt quantification was performed as described by Zheng et al (2013). A 25 μl reaction in triplicate included 2 μl DNA, 12.5 μl Power SYBR® Green PCR Master Mix (Applied Biosystems, Foster City, CA, USA), and 0.2 μM of each primer. The reactions were performed in 96-well Optical Reaction Plates (Applied Biosystems) sealed with a MicroAmpTM Optical Adhesive Film, on a StepOnePlus Real Time PCR system (Applied Biosystems). BgtF and BgtR primers (Zeng et al., 2010) were used for quantification of B. graminis by amplification of 464 bp ITS specific portion. Real time PCR conditions were as follows: an initial step at 95°C for 5 min, and 40 cycles at 95°C for 15 s, 59°C for 20 s, and 72°C for 20 s. The amount of Bgt DNA in plant samples was calculated by comparing their Ct values with the point values of the linear regression line of the standard curve.
Real time RT-PCR for expression of selected pathogenesis-related genes
Real time RT-PCR was used to monitor the expression levels of three selected pathogenesis-related genes (PR-1, PR-3, and PR-9). Total RNA was extracted by RNeasy Plant Mini Kit (Qiagen, Hilden, Germany) using 0.1 g of wheat leaves of inoculated and control plants at 10 dpi. RNA was DNase treated using TURBO DNase (Ambion™, Thermo Fisher Scientific, Waltham, USA) according to the manufacturer’s protocol, and then reversetranscribed (500 ng total RNA) using the High capacity cDNA reverse transcription kit (Applied Biosystems). PCR amplifications were carried out in an iCycler (Richmond, USA) and each reaction (20 μl) contained 1 μl cDNA, 10 μl SsoFast™ EvaGreen® Supermix 2× (BIO-RAD, Richmond, USA), and 0.25 μM of each primer. Primers used for selected transcripts (PR-1, PR-3, and PR-9) were already described by Wang et al (2016). The Ta2776 (RNase L inhibitor-like protein) gene was used as a control for the constitutive expression (Paolacci et al., 2009). The expression ratio was calculated using the 2−ΔΔCT method (Livak and Schmittgen, 2001) showing the average of three biological replicates and two technical replicates.
Data analyses
Baseline range, Ct values and real time PCR standard curves were automatically generated by using StepOne™ software (Applied Biosystems, Foster City, USA). Statistical analyses of the data were carried with a two-way ANOVA based on temperature, CO2 and their interaction as factors. Levene’s test was performed to assess the homogeneity of variance. In addition, oneway ANOVA and Tukey HSD tests were carried out on DI, death incidence, plant height, dry weight, chlorophyll content, carbohydrate content and fungal DNA quantity to determine the influence of each combination of CO2 and temperature associated with the six phytotron conditions. Statistical analyses were carried out by using SPSS software (version 24.0, SPSS Inc., Chicago, IL, USA) with a 0.05 threshold for significance.
Results
Powdery mildew development and plant death incidence
Since the homogeneity of variance has shown that a single trial was not a significant impact factor on DI (P = 0.894) and plant death incidence (P = 0.924) in all six phytotron experiments, the data were subjected to the two-way analysis of variance (ANOVA). This analysis showed that both factors, temperature and CO2, and their interaction had significant influence on DI (P < 0.001 for all) (Table 1). Four treatments with low and medium temperatures significantly affected disease development with respect to high temperature treatments: (a) low temperature and ambient CO2 (18–22°C × 450 ppm), (b) medium temperature and ambient CO2 (22–26°C × 450 ppm), (c) low temperature and elevated CO2 (18–22°C × 850 ppm), and (d) medium temperature and elevated CO2 (22–26°C × 850 ppm) (Supplementary Fig. 1). On the contrary, no disease was observed under high-temperature treatments, either with ambient or increased CO2 (Fig. 1, Supplementary Fig. 1).

Effects of temperature, CO2 and their interactions on Bgt development on wheat plants
Symptoms of powdery mildew on wheat plants inoculated with Blumeria graminis f. sp. tritici at 10 dpi under six phytotron conditions.
High CO2 content did not stimulate disease development when compared with ambient CO2 in all combinations of treatments (Fig. 1, Supplementary Fig. 1). When low temperature was applied, a slight increase in disease index was observed at ambient CO2 (1.16-fold) compared to elevated CO2, while at medium temperature the increase in disease index was considerably higher (1.95-fold) (Table 2). Similar trend in powdery mildew progress was measured in six phytotrons at 5 dpi, but disease index was noticeably lower (data not shown).
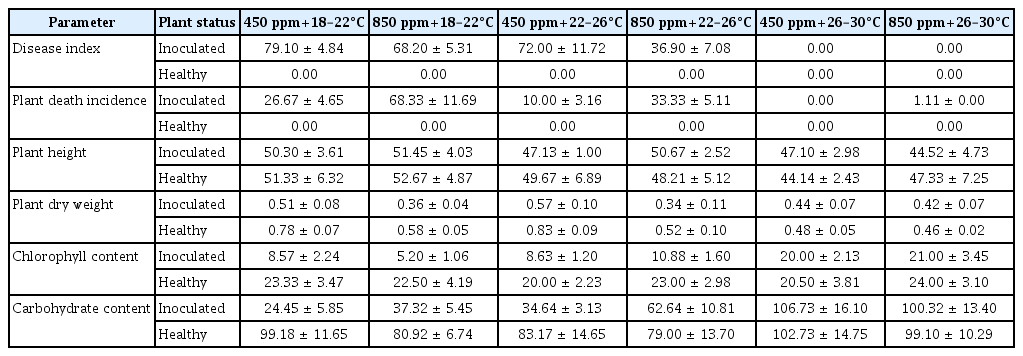
Parameter measurements of wheat plants inoculated with Bgt under different temperatures and CO2 levels
Similarly to DI two-way ANOVA analysis showed that both, temperature and CO2, and their interaction had significant influence on death incidence (P < 0.001 for all) (Table 1). While elevated CO2 content did not favour development of powdery mildew, it was more detrimental for plant vitality at low and medium temperatures. Thus, the death incidence at 20 dpi was 2.56-fold higher under low temperature, and 3.33-fold higher under medium temperature in combination with increased CO2 with respect to ambient CO2 (Table 2, Supplementary Fig. 2).
Plant growth parameters
Plant height was significantly affected by temperature with a p-value less than 0.01 (Table 1). It was highest at low temperature and high CO2 in both, inoculated and control plants (Table 2). Furthermore, it was significantly different in inoculated plants at high temperature and elevated CO2 at 10 dpi compared to medium temperature and elevated CO2, and low temperature at both CO2 levels (Supplementary Fig. 3).
Plant dry weight was significantly influenced by CO2 and the interaction of CO2 × temperature (Table 1). It decreased significantly in both, inoculated and control plants, when elevated CO2 levels were combined with medium temperatures compared to ambient CO2 levels (Supplementary Fig. 4). The highest dry weight of inoculated and control plants was measured when ambient CO2 and medium temperatures were combined (Table 2).
Chlorophyll content
Two-way analysis of variance indicated that temperature and the interaction of CO2 and temperature had a significant effect on chlorophyll content (P < 0.001 for both) (Table 1). The chlorophyll content was significantly different at 10 dpi in inoculated plants when low and medium temperatures were applied at elevated CO2 with respect to ambient CO2, while no significant difference was found between the plants grown at high temperatures for both CO2 conditions. Additionally, ambient CO2 (combined with medium or high temperatures) showed a significantly different CCI in healthy plants compared to other CO2 × temperature conditions (Supplementary Fig. 5). The lowest CCI was measured in diseased plants, when low temperature was combined with elevated CO2 (4.6-fold decrease compared to healthy plants) (Table 2).
Carbohydrate content
The carbohydrate content was significantly influenced by both CO2 and temperature and their interaction (P < 0.001 for all) (Table 1). Considering six phytotron conditions, it was significantly affected at low and medium temperature with ambient CO2 at 10 dpi in inoculated plants compared to the same temperature regime combined with elevated CO2 (Supplementary Fig. 6). The carbohydrate content was lower in inoculated plants with respect to healthy plants when low and medium temperatures were applied at both CO2 conditions. Furthermore, the highest carbohydrate content was found in both inoculated and control plants at high temperature independent of CO2 levels. A higher carbohydrate production was also measured in infected plants at elevated CO2 with respect to the ambient CO2 under low and medium temperature regimes (Table 2).
Quantitative real time PCR
Quantitative real time PCR was carried out to estimate the presence of Bgt in wheat plants at 10 dpi. The highest concentration of Bgt was measured in infected plants (40 μg of Bgt/g FW of leaf tissue, Fig. 2) grown at low temperature combined with ambient CO2 (18–22°C × 450 ppm), which have previously exhibited the highest disease index (Supplementary Fig. 1). A similar trend between quantity of fungal DNA and disease index was observed at all other phytotron conditions, with the exception of two of them (with high temperatures). Real time PCR was able to detect Bgt also in inoculated but asymptomatic plants grown at high temperature regime (with ambient CO2 or elevated CO2); the quantities were 53 and 59 ng of Bgt/g FW of leaf tissue in plants grown at 26–30°C × 450 ppm and 26–30°C × 850 ppm, respectively. On the other hand, no amplification was observed in control plants (data not shown).

Quantification of Blumeria graminis f. sp. tritici with real-time PCR in inoculated wheat plants grown in six phytotron conditions at 10 dpi, FW = fresh weight.
Expression of pathogenesis-related genes
Using real time RT-PCR, the level of expression of three PR genes were measured in healthy and inoculated wheat plants at 10 dpi (Fig. 3). All three genes (PR-1, PR-3, and PR-9) showed a similar expression pattern in each phytotron. They were down-regulated in plants grown at ambient CO2 with low and medium temperature (log2FC from −1.12 to −5.75), slightly up-regulated at high temperature with both CO2 conditions (log2FC 0.25–0.94), and moderately up-regulated at high CO2 with low or medium temperature (log2FC 2.17–3.88).
Expression of pathogenesis-related genes (PR-1, PR-3 and PR-9) by real time RT-PCR in Bgt-inoculated wheat plants grown in six phytotron conditions at 10 dpi. Gene expression changes (log2 FC) were obtained by normalization to control samples, and the Ta2776 (RNase L inhibitor-like protein) gene was used for transcript normalization. Error bars show standard deviations for triplicate assays.
Discussion
This study is the first report describing the combined influence of CO2 and temperature on wheat powdery mildew development. It was shown, that both CO2 and temperature, and their interaction significantly influenced disease progress. Thus, two CO2 regimes (ambient and high), and three temperature conditions (low, medium and high) were significantly different. Low temperatures (18–22°C) and ambient CO2 (450 ppm) were found to be the most favorable conditions for disease development, in which the pathogen reached the highest quantity. Average temperatures were also advantageous for disease progress mainly in combination with ambient CO2. High temperatures ranging from 26 to 30°C inhibited pathogen development; no typical powdery mildew symptoms could be observed, and only quantitative real time PCR was able to detect Bgt in asymptomatic wheat leaves.
In this study, high CO2 content decreased significantly disease development when compared to ambient CO2 levels. These results are in accordance with those of Thompson et al. (1993) who demonstrated reduced growth of wheat powdery mildew on plants grown at elevated atmospheric CO2 in combination with low nitrogen content or high water supply. Komáromi et al. (2013) reported also a decrease in powdery mildew infection in some wheat lines at high CO2. Furthermore, increased CO2 was not stimulatory for other powdery mildews. Thus, in barley plants the incidence of powdery mildew and the number of B. graminis conidia able to produce colonies were lower at elevated CO2 than at ambient CO2 (Hibberd et al., 1996; Mikkelsen et al., 2015). No significant powdery mildew growth was found on wheat, zucchini and grapevine at high CO2 with respect to ambient CO2 (Oehme et al., 2013; Pugliese et al., 2010, 2012). Conversely, there are few reports where an increase in powdery mildew infection was reported at elevated CO2 in soybean (Lessin and Ghini, 2009), and wheat (Bencze et al., 2013).
In this study, the interaction of CO2 and temperature significantly influenced disease development on wheat. It was reported also that a combination of CO2 and temperature had significant influence on powdery mildew progress in other hosts such as grapevine (Pugliese et al., 2010), and zucchini (Gilardi et al., 2017; Pugliese et al., 2012). This reflects the importance of influence of these two factors on different powdery mildew pathogens.
Furthermore, analysis from this study showed that both temperature and CO2, and their interaction had a significant influence on death incidence. In particular, the most harmful combination for plant vitality was elevated CO2 with low temperatures. Powdery mildew fungi do not generally kill the host plants, since they are biotrophic pathogens. However, they weaken the plants making them predisposed to death when other stress conditions occur. In our study, high CO2 content might lead to increased wheat mortality after the plant was weakened by Bgt growth. Other abiotic stresses such as ozone, drought, salinity, high and low temperature in combination with pathogen attack were reported to severely affect the vitality and growth of plants (Pandey et al., 2017). Increased plant mortality at elevated CO2 conditions can also be associated to increased aggressiveness of Bgt and altered leaf epidermal characteristics, a result which has been found at high CO2 in the Erysiphe cichoracearum/Arabidopsis thaliana pathosystem (Lake and Wade, 2009).
Plant height was significantly affected by temperature, but when combined effect of temperature and CO2 was taken in consideration, there were no significant differences in height between B. graminis-inoculated and control plants at all six phytotron conditions. Plant dry weight was significantly influenced by CO2 and the interaction of CO2 × temperature, and more profound changes were observed in dry weight of inoculated and non-inoculated plants between ambient and high CO2 combined with low and medium temperatures. The decrease in dry weight varied in infected plants between 31% and 38% at low and medium temperatures, respectively, compared to healthy plants, being in line with a similar value of 30% dry-weight decrease in Arabidopsis affected by the barley powdery mildew (Blumeria graminis f. sp. hordei; Zimmerli et al., 2004). The weight loss of wheat plants infected with powdery mildew may be associated with a lower photosynthesis rate. In fact, chlorophyll content was significantly changed by temperature and the interaction of CO2 × temperature, and CCI decrease around 1.1–4.6 fold in infected plants compared to healthy plants may reflects the overall decrease in plant weight and development.
The carbohydrate content was significantly influenced by both CO2 and temperature, and their interaction. Higher carbohydrate production was found in infected plants at elevated CO2 with respect to ambient CO2 at low and medium temperature regimes. In fact, a decreased expression of photosynthetic genes in wheat was attributed to an adaptation of photosynthesis to high CO2 conditions in controlled growth conditions (Nie et al., 1995). The increase of atmospheric CO2 due to industrial progress has been claimed to result in increased production of sugar, starch and other carbohydrates in plants by around 45% (Loladze, 2014). Furthermore, increased carbohydrate production might be associated to immunity of wheat plants acting as elicitors of defense responses (Bolouri Moghaddam and Van den Ende, 2012; Trouvelot et al., 2014). Thus, higher carbohydrate production at elevated CO2 and low and medium temperatures might be related with mild defense response of wheat against Bgt and lower DI with respect to ambient CO2 with high DI. On the other hand, the highest carbohydrate content measured at high temperatures (independently of CO2 conditions) might be associated to a more robust defense response of wheat and subsequent restraint of the pathogen development.
In this study, quantitative real time PCR assay was used for specific detection of Bgt in plant tissue. The highest Bgt quantity was measured at combinations of low temperature × ambient CO2 followed by medium temperature × ambient CO2 (40 and 21 μg of Bgt/gram FW of leaves, respectively). The real time PCR assay was particularly useful for Bgt detection in seemingly symptomless wheat plants (around 53 to 59 ng of Bgt/gram FW of leaves) grown at high temperatures and both CO2 conditions. Since the pathogen was present at relatively low quantity, the high temperatures probably inhibited spore germination which prevented disease development, and Bgt behaved similarly to a latent pathogen. These results are in line with previous reports indicating a poor spore germination of Bgt at temperatures higher than 25°C (Manners and Hossain, 1963), and a complete inhibition of spore germination and mycelium growth in other powdery mildews (Fessler and Kassemeyer, 1995; Guzman-Plazola et al., 2003; Quinn and Powell, 1982). Moreover, the results of this study confirm the utility of real time PCR for detection of latent powdery mildew infections in wheat plants (Zheng et al., 2013), and for the diagnosis of disease in early stages.
Under phytotron conditions, the most favourable combinations of temperature and CO2 levels for powdery mildew development were low and medium temperatures with ambient CO2 concentrations. While high CO2 did not favour powdery mildew development, it was more harmful for plant vitality at low and medium temperatures. Furthermore, there are reports for other pathogens such as rusts (Puccinia recondita f. sp. tritici and P. striiformis f. sp. tritici) which also do not increase significantly their incidence on wheat plants at high CO2 (Chakraborty et al., 2011; Tiedemann and Firsching, 2000). In this study, another disadvantage for the progress of powdery mildew was a high temperature regime (independently of CO2 conditions), as already observed in rusts at high temperatures; the occurrence of P. striiformis f. sp. tritici was reported to be reduced by increasing average annual temperatures (Chakraborty et al., 2002; Scherm and Yang, 1998). This suggests that these two groups of biotrophic pathogens may behave similarly on wheat under the described environmental conditions.
Moreover, under the most advantageous conditions for powdery mildew development (low and medium temperatures with ambient CO2), there was found a different transcription pattern of PR genes (their down-regulation) compared to other CO2 and temperature conditions. On the other hand, the plants grown at low and medium temperatures with high CO2 and at high temperatures and both CO2 conditions had a weak or moderate up-regulation of PR genes. These data might confirm the study by Wang et al. (2016) reporting the inducement of PR-3 and PR-9 genes in defense against Bgt. When PR-1, PR-3, and PR-9 transcripts were moderately induced the plants showed significant decrease of DI compared to DI in those plants which had the down regulation of PR genes. The influence of elevated CO2 on expression of PR genes should also be taken in consideration. In this study, the accumulation of PR genes was found at high CO2 at low and medium temperatures with respect to ambient CO2. The similar findings of PR overexpression under high CO2 were reported for PR-1 and PR-3 genes on Brassica juncea plants infected by Alternaria brassicae (Mathur et al., 2018), and for PR-1 gene on tomato plants infected by Tomato yellow leaf curl virus (Guo et al., 2016). Finally, a slight accumulation of PR transcripts at high temperatures and both CO2 conditions, found in asymptomatic plants, might be related to the already activated defense response in wheat due to a high carbohydrate production, as discussed above.
This study suggests that Mediterranean area with increased average warming and droughts (Giorgi and Lionello, 2008) might result in decreased incidence of wheat powdery mildew, especially with hot wave events during the wheat vegetation period. However, this will require further confirmations by predicting climate models for powdery mildew development in Southern Europe and Mediterranean area, similarly to already existing models in certain zones of Northern Europe (Stößel et al., 2013; Te Beest et al., 2008). A possible complication may occur if the pathogen adapts to higher temperatures. An adaptation of spore production to increased temperatures has been already recorded for Neurospora discreta in soil (Romero-Olivares et al., 2015), and for many rust fungi (Milus et al., 2009).
Supplementary data
Acknowledgments
The research that has led to these results has received funding from the European Union Horizon 2020 research and innovation program under grant agreement number 634179 “Effective Management of Pests and Harmful Alien Species-Integrated Solutions” (EMPHASIS). Authors would like to thank to Dr. Giovanna Gilardi (AGROINNOVA, Torino, Italy) for critical reading of the manuscript and helpful discussion.