Comparison of Endophytic Microbial Community in Kiwifruit Plant Cultivars
Article information
Abstract
The microbiome makes a significant contribution to plant health and endophytes may generate positive effects for the host. However, there is a limited knowledge available concerning the kiwifruit endophyte. Therefore, we discuss endophyte microbiome community structures among the kiwifruit cultivars. Total reads numbered 17620 in cv. Hayward, 11515 in cv. Haegeum and 13613 in cv. Jecygold. The number of OTUs was follows: 112 in cv. Hageum; and 87 in cvs. Hayward and Jecygold. Most of the identified OTUs were phylum Proteobacteria and it emerged that Actinobacteria, Firmicute and Bacteroidetes were mainly present. While the largest difference in Proteobacteria content is between cv. Haegeum and cv. Jecygold, they shared more OTUs than cv. Hayward. As well, this study revealed the presence of remarkably dominated OTU of Pseudomonas spp. in kiwifruit sap regardless of cultivars. To the best of our knowledge, this study is the first tone to investigate the kiwifruit endophyte-microbiome community.
Kiwifruits (Actinidia spp.) are naturally occurring throughout Asia and currently are cultivated in many countries. The genus Actinidia includes more than 70 species and grows as rampant vines (Ferguson, 2011). Major commercial kiwifruits are green (A. deliciosa) and yellow (A. chinesis) in color. During the 1970s, green kiwifruit of cv. Hayward was cultivated globally, including New Zealand and South Korea. Results of attempted breeding program, cv. Haegeum and cv. Jecygold were breed from yellow kiwifruit (Kim et al., 2017). The production of kiwifruit has increased rapidly worldwide since the 1980s due to the growing demand for kiwifruits in many places around the world (Kim et al., 2017).
Endophytes are organisms that inhabit plant tissue. Previously, endophytes were assumed only to exist in fungi, but the discovery of bacterial colonization in plants’ inner sections led to a change in definition (Chanway, 1996; Hallmann et al., 1997). The inflow endophytes occurs mainly through root hairs or natural wounds during plant growth (Frank et al., 2017). Relationships between endophytes and their host are not well understood despite much research having been conducted on various plant species. For this reason, recent studies on endophytes and their host have been undertaken and their findings indicate that bacterial endophytes show increasing signs of abiotic and biotic stress tolerance, and nutrient acquisition for plants (Moyes et al., 2016; Naylor et al., 2017). For agriculture to take advantage of these characteristics, it is essential to understand the composition of each crop’s endophytes. In this study, we present the results of pyrosequencing derived from the bacterial endophyte communities living in kiwifruit sap, according to cultivars. To improve accuracy, the sequence was clustered to OTUs based on the Divisive Amplicon Denoising Algorithm (DADA) (Rosen et al., 2012) and identified in the Silva database. These endophyte communities were then discussed in terms of bacterial canker disease and the cultivars’ characteristics.
To collect kiwifruit sap samples, representatives of the cvs. Hayward, Haegeum and Jecygold were sown in Sacheon, South Korea during the spring of 2015. Overflowing sap the plants’ trunks were collected in a 50 ml sterilized tube. Total DNA of each cultivar sap was extracted with SolGent genomic DNA Prep Kit (SolGent, Deajeon, Korea). Bacterial 16S rRNA V1–V3 regions were amplified by universal primers (27F: 5′-GAGTTTGATCMTGGCTCAG-3′ and 518R: 5′-WTTACCGCGGCTGCTGG-3′). To separate the sample, specific barcodes were fused to the primer 5′ ends. Then the amplicons were analyzed using GS-FLX (Roche, Basel, Switzerland). The raw reads were 17620 in cv. Hayward, 11515 in cv. Haegeum and 13613 in cv. Jecygold.
The raw sequences were managed by DADA2 (Callahan et al., 2016; Rosen et al., 2012) version 1.6.0 with R version 3.4.2. To increase OTUs’ clustering accuracy, 16S rRNA raw sequences were cut to create 380 base pairs since the over-lengths had a below average Phred quality score of 30, which means read accuracy was 99.9% (Supplementary Fig. 1). In order to check that Phred quality score and DADA2 error rate model matched, these were compared using the trimmed sequences (Supplementary Fig. 2). After that, OTUs clustering, chimera removal, identification and non-bacteria removal were executed in that sequence. The Silva database set (version 128) which is maintained by the DADA2 developer served as the identification reference. BioSample accession information and trimmed sequence numbers in each step are presented in Supplementary Table 1. The results were processed and visualized which were ggplot2 (version 2.2.1), ggtree (version 1.10.0), phyloseq (version 1.22.3), iNEXT (version 2.0.12), venneuler (version 1.1–0), reshape2 (version 1.4.2) and tidyr (version 0.7.2). These analyses were done utilizing intel®Core™ i5-2500 Processor (4 cores at 3.30 GHz) and Samsung 4GiB DDR3 RAM and Ubuntu LTS Linux 17.04 operating system. All packages used R code (Supplementary Fig. 3).
The result of this process was that no singleton OTUs was caused by an actual rare bacterium or an error in the sequencers. An outcome of the trimming procedure brought about limitations whereby clustered OTUs did not correspond in terms of detailed taxonomical identification due to the lengths being too short. For this reason, the rarefaction curves were parallel to the horizontal axis (Fig. 1) and: Chao1 indices estimated richness by focusing on rare OTUs as being the same as the number of OTUs. Shannon and Simpson diversity indexes proved to be the lowest in the cv. Jecygold sample (Fig. 2).
Rarefaction curve of endophytic bacteria. The curves describe OTUs number and reads. OTUs number is same between cvs. Hayward and Jecygold. cv. Haegeum is diverse more than others.
Alpha diversity of endophytic bacteria at OTUs. cvs. Hayward and Jesigold has same Chao1 index, 87. cv. Haegum Chao1 index is 112.
Collectively, the specific kiwifruit saps analyzed in this study had 12 phyla, 26 classes, 47 orders, 76 families and 150 genera (Fig. 3). The identification mostly proceeded at genus level because their raw reads were trimmed to 380 base pairs as a matter of quality for the purposes of accuracy. In each cultivar, the endophytes shared common features in that Proteobacteria were the most dominant (> 80%) but this trend was less noticeable in cv. Haegeum. The second dominant endophytes were Firmicute, Bacteroidetes and Actinobacteria (Fig. 4). Among the cultivars, cv. Haegeum confirmed the highest number of Actinobacteria, which are known to produce various secondary metabolites. Although the endophytes in cvs. Haegeum and Hayward were most similar at the phyla level, the proportion of OTUs proportion mostly resembled cvs. Haegeum and Jecygold (Supplementary Fig. 4). This finding was supported by shared OTUs between cvs. Haegeum and Jecygold, and there were more of these when compared to the other kiwifruit cultivars (Fig. 5). However, our findings may be too premature to make a solid conclusion, due to the lack of biological replication. Nonetheless this is the first attempt to analyze kiwifruit sap microbiome communities with major cultivars of kiwifruit.

Phylogenetic tree and heatmap meaning amount of kiwifruit endophytic bacteria.
Number of endophytic 16s rRNA reads at Silva database.
Venn diagram of OTUs. (A) all shared the OTU number, (B) all shared the OTU proportion.
To find the dominant endophyte and universality in the communities, the top 10 OTUs were selected and all shared OTUs were compared. Only 10 OTUs were identified as being shared (Fig. 5A), but their relative proportions were very high, ranging from 50.6% to 72.2% (Fig. 5B). As well, four OTUs among the top 10 OTUs emerged as being shared (Table 1). It is interesting to note that the top 10 OTUs were mainly identified in the genus Pseudomonas. The differences in these OTUs sequences are depicted in Supplementary Fig. 5. Based on what is illustrated in this figure, it can be concluded that a small number of endophytes was dominant in the kiwifruit saps. To more accurately identify them, the largest OTUs were analyzed using the NCBI (https://www.ncbi.nlm.nih.gov/) nucleotide collection database and standard nucleotide basic local alignment search tool (BLASTn) (Table 1). The BLASTn results revealed that 99 bacteria were matched and of those bacteria 10 were Pseudomonas syringae pv. actinidiae (PSA) (Supplementary Table 2). In general, pathogenic Pseudomonas was identified as causing severe economic damage in many crops (Mansfield et al., 2012). PSA causes bacterial canker disease in kiwifruit and this disease’s symptoms include black spot on leaf, blight leaf, dehydrated branches, floral necrosis and flowing red ooze that triggers wilt (Vanneste, 2017). The dominant endophytes were mainly Pseudomonas and the OTUs numbered about half in each cultivar of the genus Pseudomonas (Table 1). The others in the top 10 OTUs did not ideally correspond to PSA. Proceeding from this fact, it was not evident if the top Pseudomonas had the PSA pathogen, but it did certainly taxonomically resemble the PSA or a collection of it. This is especially the case since the query involved only 380 base pairs. Based on this evidence, it seems reasonable to suggest that aboriginal Pseudomonas living in kiwifruit trunk had competed against PSA before the bacterial canker occurred.
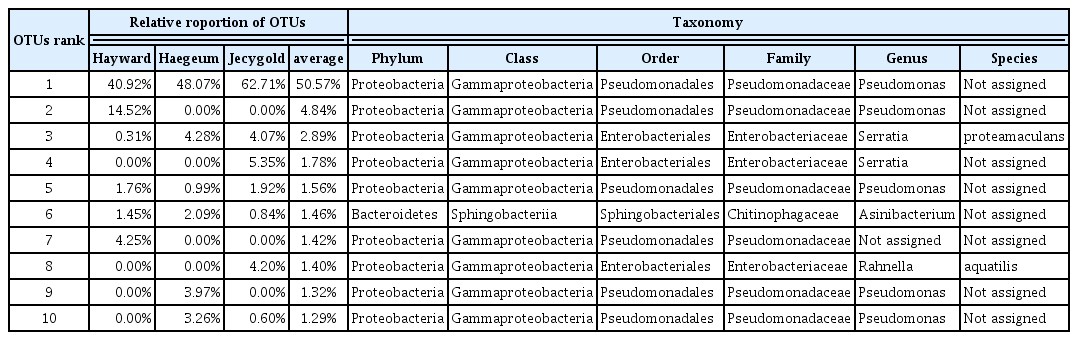
Average relative proportion of top 10 OTUs in each cultivar of kiwifruit sap
Kiwifruit endophytes existed mainly in the form of Proteobacteria, Firmicute, Bacteroidetes and Actinobacteria. Actinobacteria is known to produce various secondary metabolites and an important source for developing novel bioactive compounds. However, searching for a bioactive product in endophytic Actinobacteria is yet to reveal many aspects (Matsumoto and Takahashi, 2017). It was recently reported that cv. Haegeum is more resistant than cv. Hayward against PSA, fungal leaf spot and powdery mildew (Kim et al., 2015). In endophytic communities, Actinobacteria was more evident in cv. Haegeum than other cultivars. Considering our findings and what has been documented in previous reports, the resistance of cv. Haegeum against PSA may be greatly assisted by endophytic Actinobacteria and developing the endophytic Actinobacteria as microbial pesticides to prevent or minimize PSA infection.
In conclusion, this study provides a stepping stone for explaining the structure of kiwifruit endophytic communities. These communities confirmed that the cultivars’ characteristics were strongly correlated. Furthermore, our data may contribute to a better understanding why PSA causes infection and why cv. Haegeum can be considered a cultivar that tolerates bacterial canker disease.
Supplementary data
Acknowledgments
This research was supported by the Next-Generation Bio-Green 21 Program (PJ013250).