Detection of Clavibacter michiganensis subsp. michiganensis Assisted by Micro-Raman Spectroscopy under Laboratory Conditions
Article information
Abstract
Clavibacter michiganensis subsp. michiganesis (Cmm) is a quarantine-worthy pest in México. The implementation and validation of new technologies is necessary to reduce the time for bacterial detection in laboratory conditions and Raman spectroscopy is an ambitious technology that has all of the features needed to characterize and identify bacteria. Under controlled conditions a contagion process was induced with Cmm, the disease epidemiology was monitored. Micro-Raman spectroscopy (532 nm λ laser) technique was evaluated its performance at assisting on Cmm detection through its characteristic Raman spectrum fingerprint. Our experiment was conducted with tomato plants in a completely randomized block experimental design (13 plants × 4 rows). The Cmm infection was confirmed by 16S rDNA and plants showed symptoms from 48 to 72 h after inoculation, the evolution of the incidence and severity on plant population varied over time and it kept an aggregated spatial pattern. The contagion process reached 79% just 24 days after the epidemic was induced. Micro-Raman spectroscopy proved its speed, efficiency and usefulness as a non-destructive method for the preliminary detection of Cmm. Carotenoid specific bands with wavelengths at 1146 and 1510 cm−1 were the distinguishable markers. Chemometric analyses showed the best performance by the implementation of PCA-LDA supervised classification algorithms applied over Raman spectrum data with 100% of performance in metrics of classifiers (sensitivity, specificity, accuracy, negative and positive predictive value) that allowed us to differentiate Cmm from other endophytic bacteria (Bacillus and Pantoea). The unsupervised KMeans algorithm showed good performance (100, 96, 98, 91 y 100%, respectively).
Introduction
The tomato crop (Solanum lycopersicun L.) is a domesticated species belonging to the Solanaceae family. Taxonomically, it is located in the Lycopersicon section alongside 13 related wild species, which can be found on the western coast of South America (Ecuador, Peru, and Chile), this region is considered to be their center of origin; nevertheless, domestication of cultivated tomato occurred in México (Knapp and Peralta, 2016). The global importance of the tomato crop resides in the fact that its fruits are an important source of vitamins and minerals in the human diet, as they are frequently consumed both fresh and processed, amounting to 120 million tons produced annually worldwide (Colvine and Branthôme, 2016; FAO, 2017). Corporate farming is supported by cultivating high-performing varieties, which also enhance desirable traits to consumers and tend to be grown in monocropping systems on broad swaths of farmlands. Nevertheless, even with the availability of phytopathogen resistant cultivars, the emergence of new pathogen strains and antibiotic-resistant variants constitute risk factors that may potentially prompt an epidemic outbreak that could undermine food security (Fletcher et al., 2006).
Evaluating and predicting pathogen effects on cultivars represent a continuous challenge due to the low genetic diversity of crops, which increases the potential for pathogen spreading rate and crop damage. Thus, it is necessary to advance in the development of new technologies and infrastructure to execute more-robust surveillance mechanisms, appropriate sampling protocols, and disease diagnosis techniques (Fletcher et al., 2006). Currently, there are many types of methods for rapid and accurate identification of dangerous biological agents, these can be further divided into conventional, and modern technologies, and there are also integrated and automated diagnostic systems for detection and identification of microorganisms (Mirski et al., 2014). Raman spectroscopy belongs to the family of vibrational spectroscopic techniques, the instrument creates specific Raman spectral fingerprints by recording the molecular vibrations of the cellular compounds, and it is currently advertised as a hot and ambitious technology that has all of the features needed to characterize and identify bacteria, because Raman fingerprint represents the complete information of the biochemistry of the cell (Ashton et al., 2011; Lorenz et al., 2017). A modern Raman microscope allows to analyze bacteria at single-cell level and the application of this approach can be used to readily and specifically detect plant pathogens (Gan et al., 2017). Moreover, this technique can even be employed for functional analyses of microbial communities, but its biggest challenge is that spontaneous Raman signals are naturally weak, especially at single cell levels (Wang et al., 2016).
The present research is focused on the study of Clavibacter michiganensis subsp. michiganensis (Cmm), which causes the bacterial canker of tomato (BCT), a quarantine-worthy pest included on the list of regulated plant pests in Mexico and the United States of America, among other countries (EPPO, 2016). Cmm bacterium spreads by seeds and it is highly contagious. At the moment, there are no genetic materials showing resistance or tolerance to the Cmm bacterium (Sen et al., 2013). BCT occurrence is usually erratic, the disease is asymptomatic at its early stages, and the compatible interaction between Cmm and tomato is an extremely complex and multi-faceted biological system, one of whose facets is the level of genetic variability in each organism (Martínez-Castro et al., 2018).
Therefore, the objective of this research involves evaluation under controlled conditions the utility of Raman spectroscopy (532 nm λ laser) technique to reduce the time for bacterial recognition by using a preliminary detection of Cmm colonies through its Raman spectrum fingerprint and chemometric analyses in stationary laboratory conditions.
Materials and Methods
Experimental establishment and plant inoculation
The experiment was conducted with Ramses F1 (Harris Moran®) tomato plants (S. lycopersicun L.). The trial was conducted under net-house conditions in the CIACyT-UASLP located at coordinates 22.150715 N, -101.025097 W, and elevation of 1850 MASL. We used a completely randomized block experimental design composed of four blocks (rows) and 13 plants per block (repetitions). All the plants were kept isolated using anti-aphid mesh (net-house) in a fertirrigation system in plastic growing bags with a peat-based substrate (Premier® Horticulture Inc. Canada), and agronomic practices were implemented (irrigation, fertilization, and crop management) in accordance to recommendations for the zone (Jasso et al., 2012).
After 5 weeks of growth cycle, nine randomly selected plants were inoculated with Cmm bacteria. The Cmm pathogenic isolate was supplied by the National Center of Genetic Resources (CNRG) under the auspices of the National Forestry, Agricultural, and Livestock Research Institute (INIFAP). The selected method to inoculate the plants drew on Sen et al. (2013) with some modifications. The inoculum was prepared with Cmm isolate (supplied by CNRG-INIFAP) grown on Luria-Bertani (LB) liquid medium at 28°C at 150 rpm until reached an optical density of 0.2 at 600 nm (Multiskan GO™, Thermo Fisher Scientific Inc.) corresponding to about 108 cfu/ml. A piece of sterilized cotton soaked with 100 μl of the bacterial solution was held (Parafilm®) upon 2 superficial incisions of 2 mm long located at stem section between the second and third true leaf. For the negative controls, three plants were inoculated with sterile distilled water. Finally, the plants were wrapped in polyethylene bags to raise the relative humidity over a 24 h period. After this time period, the Cmm inoculated plants were placed within the original plant population that conformed the experiment to induce contagion to neighboring plants and the disease epidemiology was evaluated.
Evaluating the severity and incidence of BCT
Disease incidence and severity were evaluated daily for 40 days until the plants reached 14 weeks of age. Severity was evaluated using the scale proposed by Sen et al. (2013), consisting of five categories: no symptoms = 0; one leaf with wilting symptoms = 1; more than one wilted leaves, less than 50% of the leaves with wilting symptoms = 2; between 50% and 75% of leaves wilted = 3; more than 75% of leaves wilted but less than 100% = 4; the entire plant wilted and dead = 5. Relative incidence (Inc-R) was defined as the number of plants with symptoms of the disease observed only on the date of evaluation, while cumulative incidence (Inc-C) amounted to the total number of plants that showed symptoms before and during the evaluation. The spatio-temporal pattern of the epidemic was analyzed using zone mappings under the interpolative geostatistical analysis method in the Surfer® program vers. 14, represented by three-dimensional and contour maps. Additionally, Morosita aggregation indices were calculated pursuant to Campbell and Madden (1990), and the area under the disease progress curve (AUDPC) was calculated using the Guillén-Sánchez et al. (2003) trapezoid method. Temperature and precipitation weather variables were monitored using a Davis Vantage Pro2™ (Davis Instruments, Hayward USA) weather station.
Cmm isolation and molecular identification
The phytosanitary analysis was performed on all plants than conformed the experiment at 14 weeks of age to determine the presence of Cmm in plant’s vascular tissue. The procedure consisted of cutting 10 cm of stem located between the second and third leaf, which were then washed with soap and running water, superficially disinfected with 70% alcohol (2 mins) and 1.5% sodium hypochlorite (1 min), and rinsed with sterile deionized water. Later, the stems were dissected and the internal vascular stem tissue with brown coloring was extracted and submerged in 5 ml of sterile distilled water for 15 mins. The suspended mixing allowed diffusion of bacteria out of plant tissue and the bacteria were grown in Nutritive Agar medium (Bioxon™) and incubated at 28°C for 72 h. Bacterial colonies isolated were purified and classified pursuant to their colony morphology and Gram staining (EPPO, 2016).
The bacterial genomic DNA was extracted using lysis buffer (Tris Base 50 mM, EDTA 50 mM, and SDS 3%), in accordance with the procedure described by Sambrook and Russell (2001) beginning with bacterial isolates that had been previously augmented in B-King liquid media for 24 h at 28°C (EPPO, 2016). The PCR amplification process was done using the genomic DNA of the genetic region 16S of ribosomal DNA with oligonucleotides F27 (5′-AGAGTTTGATCMTGGCTCAG-3′) and R1492 (5′-TACGGYTACCTTGTTACGACTT-3′) under the following conditions: 95°C for 5 mins, followed by 35 cycles at 95°C for 45 s, 55°C for 45 s and 72°C for 90 s, and a final extension at 72°C for 5 mins (Monciardini et al., 2002). PCR products of expected sizes were purified and sequenced. The taxonomic assignment of partial sequences larger than 1 Kb of 16S rDNA genes was performed with the classification service implemented in the SINA Alignment Service using the SILVA database with default parameter settings, the minimum identity with the query sequence was adjusted to 0.90 (Pruesse et al., 2012; Quast et al., 2013). The BLASTn algorithm was used to search the NCBI GenBank database (Benson et al., 2010) to confirm taxonomical assignment of sequences.
Detection of Cmm assisted by Micro-Raman Spectroscopy
The preliminary detection of Cmm through its Raman spectrum fingerprint was done under stationary laboratory conditions. The analysis was carried out according to Paret et al. (2010, 2012) with some modifications. All the bacterial pure isolates (colonies) obtained were grown individually in LB liquid media (5 ml) and incubated at 28°C and 200 rpm until reached an optical density of 0.1 at 600 nm. The bacteria was individually harvested by centrifugation (14,000 rpm for 3 mins at 8ºC) and washed once in 0.85% NaCl and twice using sterile deionized water. Cells washed were resuspended in 100 μl of sterile deionized water and the optical density was adjusted to 0.1 at 600 nm (Paret et al., 2010). For the Micro-Raman analysis, a polished mirror aluminum sheet of 20 × 30 mm2 and 0.2 mm in thickness, with made micro-cavities of 300 μm diameter was used as a substrate to obtain the Raman spectra (Misra et al., 2009). The aluminum substrate was cleaned with methanol and dried, 3 μl of each processed bacterial suspensions were placed in a separated micro-cavity (4 repetitions per pure isolate) and left to dry for 30 minutes. Negative control samples were obtained without the addition of bacteria (sterile deionized water). The corresponding Raman fingerprint was obtained from the bacterial sample deposited on the micro-cavity using a Raman Confocal Horiba XploRA ONTM™ (Horiba Scientific, Ltd.) microscope equipped with a 532-nm (HeNe) under the following conditions: spectral range of 100–2000 cm−1, acquisition time 10 s to avoid sample damaging, laser power ≈ 20 mW, 1200 gr/mm grating, slit 100 μm, hole 300 μm, 10X lens (microspot with 10 μm diameter) and CCD cooled detector with Peltier system. The CDD resolution is 2 cm−1.
Spectral Preprocessing and Computational Analysis
Raman spectra datasets obtained from different bacterial colonies were identified and stored in comma separated values (CSV) format, then, they were preprocessed to eliminate background fluorescence by subtracting a fifth-order polynomial from the original spectra and normalizing them to the area under the curve measure for the entire spectral range using the Vancouver Raman Algorithm program (Zhao et al., 2007). To perform the computational operations on our data, we wrote the corresponding preprocessing and calling routines on Python programming language. We employed the Scikit-Learn (Pedregosa et al., 2011) library, which is a collection of machine learning libraries used in several fields of research. We used Principal Components Analysis (PCA) (Wold et al., 1987) for feature selection, then, we applied Linear Discriminant Analysis (LDA) and KMeans clustering algorithm as classifiers.
PCA is a widespread method employed for dimensionality reduction, multivariate correlation analysis and model quality evaluation. It is based on the projection of a set of n data samples {Xi} with Xi = (xi, …, xim) from a m-dimensional space, onto a k-dimensional feature space generated by a basis of orthogonal eigenvectors {ê1, …, êk} corresponding to the k largest eigenvalues {λ 1, …, λ k} of Xi (Abdi and Williams, 2010). PCA can be used to increase class separation among elements in a dataset by reducing correlation of the projected representation as each λ i is a measure of the variance along the respective direction êi (Jolliffe, 2002). PCA projection matrix W is obtained mainly through Singular Value Decomposition (SVD) on modern software (Abdi and Williams, 2010). In this study we employed PCA to obtain a previous feature selection for the classifiers used in order to improve their performance. The number of components Ncomp used for PCA was chosen in such way that it gave optimal results for all methods, so their performance could be compared in a consistent manner. To this end, a sequential execution of the algorithms used in this work was performed and the metrics were recorded for each execution, iterating over the range of Ncomp ∈ [1, 50]. We restricted the number of testing components to this range because eigenvalues λ i of our dataset became very close to zero for i > 50, and they could not be accurately represented by computer double precision floating point data types, making PCA numerically unstable beyond such range. Once Ncomp was determined, we used this value for all classification algorithm executions. Metrics taken from algorithms using a previous step of feature selection with PCA, were all using the same number of components Ncomp.
LDA is a supervised feature selection and classification method, which simultaneously maximizes the distance between the mean classes while minimizing the variance within each class. Considering a set of samples {Xi} of m-dimensional vectors partitioned into N = 2 subsets {Xi} = A∪B, A ∩ B = Ø, A, B ≠ Ø with maximally separate means μ A and μ B and minimal within class variance (Xanthopoulos et al., 2013). For the case N > 2 classes, LDA is generalized to Multiclass LDA by the use of multivariate analysis of variance. Although LDA can be used for both feature selection and classification, due to the high dimensionality of the Raman spectrum samples, we use it in here only as a classifier. We divided the dataset into two subsets for training and testing executions, each one containing respectively 70% and 30% of the original data in a random way.
Additionally, the KMeans clustering is an efficient unsupervised clustering algorithm often used for the large number of samples and features (Izenman, 2008). In the KMeans algorithm, an initial set X = {Xi} of n samples, is partitioned into C = {C1, …, Ck} classes. KMeans tries to minimize the distance of an element Xi to the centroid μj of the cluster Cj at which Xi belongs, by iteratively real-locating the μ j positions, the resumed steps for KMeans are describe in Hartigan and Wong (1979) and Jolliffe (2002). To perform the unsupervised classification on the Raman spectra dataset, we executed 20 repetitions of the KMeans algorithm with different random initializations.
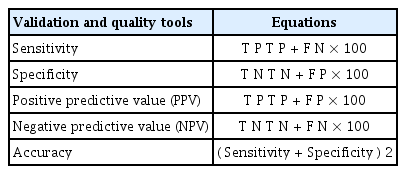
Finally, to evaluate the performance of the classifiers employed in this paper (PCA, LDA, PCA+LDA and PCA+KMeans), we compute several metrics used for binary classification assessment (Siqueira and Lima, 2016; Velez et al., 2007), that includes metrics corresponding to Sensitivity (SENS), defined as the confidence that a positive result for a sample of the labeled class is obtained; the Specificity (SPEC), which is the confidence that a negative result for a sample of non-labeled classes is obtained; the Positive Predictive Value (PPV) measuring the proportion of positives that are correctly assigned, the Negative Predictive Value (NPV) which measures the proportion of negatives that are correctly assigned, and finally the Accuracy (ACC), that is the proportion of all tests that are correctly classified (Santos et al., 2017). Table 1 summarizes these equations.
Quality metrics used
To have an insight into the performance behavior of each algorithm we computed the correlation ri,k of the original spectral band Yi at the Raman spectrum of the samples to the k-th principal component by the equation:
Where α ik is the j-th coefficient of the eigenvector êk (Jolliffe, 2002).
Results
Incidence and severity of the bacterial canker of tomato
The plants analyzed were classified into one of three categories due to the disease behavior: (i) plants inoculated with Cmm (In+), (ii) plants positively infected by contagion with Cmm (Co+), and (iii) negative asymptomatic plants (N−). After forty-eight to seventy-two h of Cmm inoculation, the infected tomato plants (In+) began to show disease symptoms of bacterial canker of tomato (BCT), the entire leaves became wilted and the stem tissue showed discoloration at the inoculation point; however, some plants later became asymptomatic and the inoculation site on the stem evolved into a corky canker.
The relative incidence (Inc-R) behaved dynamically in the population, with a waxing and waning number of symptomatic plants. The experiment began with 9 plants artificially infected with Cmm (In+), but 23 days later, 40% of the population (21 plants) simultaneously showed some degree of disease severity (In+, Co+); nevertheless, the cumulative incidence (Inc-C) observed over the 40 days of evaluation amounted to 79% (38 plants), peaking at 24 days after the epidemic was induced. BCT disease progress curve of the Inc-C behaved logarithmically (R2 = 0.859) (Fig. 1).
Temporal progress curves of relative incidence (Inc-R) and cumulative incidence (Inc-C) of tomato plants infected with C. michiganensis subsp. michiganensis.
The severity of the symptoms associated with Cmm also behaved dynamically, at both the individual and population levels, as they were displaying rising and falling values over the growth cycle. The interpolation maps confirmed the observations made throughout the experiment (Fig. 2). The scale value 5 (dead plant) was observed solely in two artificially-inoculated plants (In+), but the 7 remaining inoculated plants (In+) exhibited values ranging from 0, 1, 2, and 3 on the scale. Comparing the area under the disease progress curve (AUDPC), the artificially-infected plants (In+) exhibited statistically higher values (P ≤ 0.05) (AUDPC = 25) than the contagion-infected plants (Co+) (AUDPC = 6.3), and the last ones (Co+) were generally those neighboring the artificially inoculated plants (In+). Only 11 plants (21%) were symptom-free (N−) 40 days after the epidemic was induced, and their AUDPC values were practically null. The spatio-temporal pattern, two days after the epidemic was induced (DDI) resembled the structure of a uniform distribution (Morisita Index: < 1), but later evaluations showed an aggregated pattern (Morisita Index: 1.7) (Fig. 2) (Campbell and Madden, 1990). It is worth to note that the highest incidence occurred in rows 3 and 4, where runoff converged during irrigation, and that incidence was most evident 23 days after the epidemic was induced (Fig. 2).

Interpolation maps of disease severity: 2 days (Morisita Index: < 1) and 23 days (Morisita Index: 1.7) after the epidemic was induced (DDI) with C. michiganensis subsp. michiganensis in tomato plants.
Molecular Identification of Cmm
The bacterial colony morphology of the Cmm isolate provided by CNRF-INIFAP and used in the experiment could be characterized as follows: Gram (+), yellow, circular, smooth-edged, flat and elevated surface, and creamy texture. The phytosanitary analysis performed at 14 weeks of age in plant population to determine the presence of Cmm in the vascular tissue, allows the isolation of different bacterial colonies from the symptomatic and asymptomatic tomato plants (In+, Co+) and displaying different colony morphologies. Strains with colony morphologies similar to the Cmm isolate (supplied by CNRG-INIFAP) were obtained from both inoculated (In+) and contagion infected (Co+) plants and they showed the same colony morphology of previously described Cmm CNRF-INIFAP isolate. The molecular 16S rDNA analysis of reisolated bacterial strains were classified as Clavibacter michiganensis subsp. michiganensis (NCBI Accession Numbers: HQ144239.1, KR922121.1, HQ144230.1, HQ144239.1, KR922121.1, HQ144230.1). Additionally, other endophytic bacteria were isolated and molecularly identified, turning out to be the genera of Bacillus sp. (NCBI Accession Number: HM566983.1) and Pantoea sp. (NCBI Accession Number: MF352035.1, KU933320.1). Therefore, in our study we confirmed the infection of tomato plants with the virulent Cmm CNRF-INIFAP isolate.
Spectral Raman features
The Micro-Raman instrumentation allows to obtain the spectral signature of Cmm and the acquisition time (10 s) does not cause any bacterial cell damage (Fig. 3A). The characteristic Raman spectrum of the Cmm CNRF-INIFAP isolate was characterized by wavelength peaks at 944, 992, 1146, 1179, 1254, 1435, 1510, 1568, and 1656 cm−1 (Fig. 3B). The respective peaks varied in relative intensity, but among them, bands at 1146 and 1510 cm−1 stand out, which are the vibrational modes of the C=C and C–C bonds (stretching) of the trans isomer in the carotenoids (Jehlička and Oren, 2013). The 992 cm−1 band, matching vibrational mode A1g of the benzene ring (Chen et al., 2007), and band 1179 cm−1, associated with the saccharides (Athamneh and Senger, 2012), generally found as components of the cell wall in Cmm, were observed at smaller intensity. Bands with relatively weak intensity were found at wavelengths 944 cm−1, associated with phenyl ring CH and COH (bend) (Maiti et al., 2013), band 1254 cm−1, associated with mode νasym (O-P-O) (Movileanu et al., 1999), band 1435 cm−1 associated with vibration C-C stretch (D-Band) and the band 1568 cm−1 characteristic of carbon G band (C-C) (Malard et al., 2009) and, finally, the band 1656 cm−1, associated to ν(C=O) of the amide I (Gelder et al., 2007). Raman spectra of Pantoea sp. (Fig. 3C) and Bacillus sp. (Fig. 3D) were different from those observed in Cmm (Table 2), and their Raman spectra match those previously reported by other authors (Polisetti et al., 2016). It is important to keep in mind than during routine analysis, control samples (positive and negative) should always be included, because slight instrumental displacements (± 5 cm−1) may happen during spectral measurements.
Raman spectra obtained at 532 nm λ corresponding to the bacteria: (A) Clavibacter michiganensis subsp. michiganensis, raw spectra (B) C. michiganensis subsp. michiganensis preprocessed spectra (average 4 repetitions), (C) Pantoea sp., and (D) Bacillus sp.
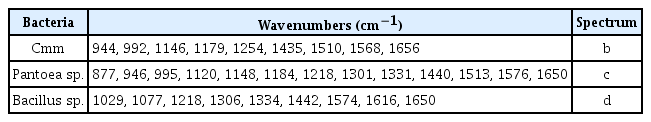
Peak positions of the Raman bands of the bacteria isolated in this work. Spectra were recorded in the 800–1800 cm−1 region, with a 532 nm λ laser
Computational Analysis
Supervised and unsupervised computer classification analyses were conducted on 75 bacterial isolates, of which 22 were Cmm and 53 were endophyte bacteria (Bacillus sp. and Pantoea sp.). To automatically classify our spectra dataset we proceeded in the following way: we applied the unsupervised KMeans classifier directly to the Raman spectra data (KMeans), we also classified the spectra by previously performing dimensionality reduction via PCA, and selected the first 12 principal components of each spectrum (PCA+KMeans). For the supervised LDA method we also applied the classifier directly over spectral vector (LDA) and we also use it in conjunction with PCA (PCA+LDA).
The number of principal components for feature selection than produced simultaneously an optimal performance for both PCA+KMeans and PCA+LDA algorithms was searched as described in the methodology section. The value found was Ncomp = 12. Naturally, the optimal values found on each case were very different, even though they were using the same value of Ncomp at the PCA feature pre-selection stage. The explained variance for each of the first 12 principal components of our dataset, along with their corresponding cumulative values are depicted in Fig. 4, which shows that these components account for 98.2% of the total variance.
The number of principal components for feature selection and classification of Raman spectra with supervised and unsupervised algorithms.
We see that the KMeans classifier can differentiate Raman spectral signatures of the bacteria analyzed (Cmm vs Endophytic) when it is applied directly to them with SENS of 100%, SPEC of 96%, ACC of 98%, PPV of 91% and NPV of 100%. On the other hand, Table 3 shows an important loss on performance metrics for KMeans when used along with PCA dimensionality reduction (PCA+KMeans).
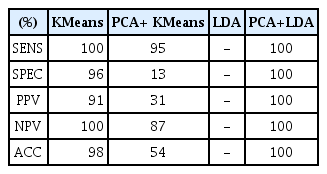
Performance metrics of classifiers (percentage)
The LDA classifier did not manage to distinguish the two groups (Cmm vs Endophytic) when applied directly to the spectral samples. Therefore, to reduce the ratio of the number of dimensions to number of samples, we opted to use feature selection via PCA. The execution of the PCA+LDA method returned an exact classification and the performance evaluation were of 100% for SENS, SPEC, ACC, PPV and NPV, without producing any false positive (FP) or false negative (FN). On our tests, PCA+LDA can achieve better levels of specificity and accuracy than KMeans. We also observed that PCA+LDA has a low probability of overfitting when applied to identify Raman spectra of Cmm against endophyte bacteria signatures, as in our experiments the testing and training datasets returned exactly the same classification.
The class centroids (means) found by KMeans applied directly to Raman spectra are displayed in Fig. 5 and the Fig. 6 illustrates the corresponding centroids when KMeans is applied to the principal components extracted by PCA. Note that the values shown do not belong to the principal components but to the projection of the class centroids onto such components. Fig. 7 shows the class centroids found by LDA applied over the same principal components and stand out the PCA1, PCA8 and PCA9; additionally, the absolute values of the components of the eigenvector estimated by LDA are shown in Table 4 in order to have visual comparison of the components weights used by the LDA classifier.

Class centroids obtained by KMeans classifier for Raman spectrum samples of C. michiganensis subsp. michiganensis and Endophytic bacteria.

Class centroids obtained by KMeans classifier for principal components of Raman spectrum samples of C. michiganensis subsp. michiganensis and Endophyte bacteria.
Class centroids obtained by LDA classifier for principal components of Raman spectrum samples of C. michiganensis subsp. michiganensis and Endophyte bacteria. Stems represent absolute values of components of the eigenvector used by LDA for class separation.

PCA correlations to spectral bands associated to key compounds (bold-typed) to differentiate C. michiganensis subsp. michiganensis bacteria (fingerprint)
Discussion
The pathogenic relationship between the tomato (S. lycopersicum) and the Cmm bacterium arose before the crop was domesticated. In this evolutionary process, the bacterium adapted itself to the vascular tissue as an endophyte, subsequently it evolved as a pathogen (Bentley et al., 2008). As such, the bacterium can systematically infect the plant through the vascular tissue, and in the early stages, the pathogen behaves like a biotrophic organism, inducing latent asymptomatic infections (Eichenlaub and Gartemann, 2011; Sharabani et al., 2013).
In this research, the Cmm-inoculated plants began to show disease symptoms from 48 to 72 h after inoculation; however, the evolution of the incidence and severity varied over time in the plant population. The plants inoculated at the beginning of the experiment displayed more severe symptoms pursuant to the area under the disease progress curve (AUDPC), and several even died (22%). Contrary to that, the plants infected by contagion remained asymptomatic, in accordance with previous reports, mentioning that plant age can lead to asymptomatic infections, until the plant reaches the productive stage and the seeds of the fruits become Cmm’s principal means of spreading (Eichenlaub and Gartemann, 2011). The concentration of the bacterium at the time of the infection is also determinant, because in concentrations below 104 colony-forming units (CFU), the movement of the bacterium is limited, but at 108 cfu, the bacterium moves up and down in the vascular tissue of the plant from the point of inoculation (Xu et al., 2010).
The contagion between plants advanced rapidly, reaching 79% just 24 days after the epidemic was induced. Chang et al. (1991) reported similar results, remarking that the speed of the epidemic is a function of the initial disease incidence. The irrigation water is likely to be the principal mean by which Cmm spreads (Xu et al., 2010), because during the experiment the highest disease incidence was found in rows 3 and 4. Additionally, the plants infected by contagion, generally were located in proximity to the inoculated plants, due to close contact between them (Xu et al., 2010), leading to clustered (foci) distribution patterns 23 days after the epidemic was induced. This outcome agrees with Kawaguchi et al. (2010) results, who mentioned that in addition to irrigation water, infected material (seed and/or seedling), leaf-pruning, and disbudding practices all condition the directionality of infections and how they cluster. Therefore, the opportune detection of Cmm symptomatic plants, allows defining the hotspots for bacterial dispersion with a preponderance of aggregated spatial pattern. In addition, the cultural conditions (irrigation, pruning directionality and environmental conditions) will conditioned the samplings protocols design to determine the cumulative incidence of the BCT disease. It is worth mentioning that on cool (26–28°C), cloudy, and rainy days, the unilateral wilting symptoms and marginal leaf necrosis were exacerbated, as these conditions are likely to boost bacterial growth inside the plant (Sen et al., 2015).
The complex parasitic relationship between S. lycopersicum and Cmm renders many of the epidemiological monitoring mechanisms moot (Sen et al., 2013), and because Cmm is considered a quarantine-worthy pest in various countries and economic regions, early detection becomes indispensable in order to implement timely measures to eradicate the pest and thereby to prevent it from spreading. The Micro-Raman spectroscopy used to differentiate Cmm bacteria isolated from symptomatic and asymptomatic plants stood out most for its speed, because the spectral analysis of the bacterial cells is done in a matter of minutes. The phytosanitary analysis, the most time spend is used to isolate the bacteria from the plant tissue; moreover, the spectral traits of Cmm allows to differentiate them from other endophytic bacteria, even those with similar colony morphology (Paret et al., 2010). Bands 1146 and 1510 cm−1 are the primary markers that set Cmm to separate from the rest of the bacteria that are found in the vascular tissue and these bands are associated with vibration modes of the carotenoids that are a structural part of the Cmm membrane (Saperstein et al., 1954).
The chemometric analysis and performance evaluation demonstrated that PCA+LDA was the best classifier algorithm with 100% of SENC, SPEC, ACC, PPV and NPV; it was followed by KMeans algorithm applied directly on spectral band values. The classifiers PCA+KMeans algorithm and single LDA alone used as a classifier did not show good performance. To explain why PCA+LDA performed much better than PCA+KMeans, we want to point out that LDA employs discriminant coefficients that minimize intra-class variance while maximizing interclass separation. For our samples, we can see in Fig. 7 that LDA assigns the largest discriminant coefficients to the principal components PC1, PC8, and PC9. The local peaks of principal component correlations to original spectral band and their numerical values are shown in Table 4. Some correlation peaks correspond to wavenumbers of vibrational modes of key compounds linked to presence of Cmm. Specifically the bands at 944, 992, 1146, 1254, 1510, 1568, and 1656 cm−1, which are marked in bold types, but the higher correlation values corresponded to the carotenoid bands (1146 and 1510 cm−1) that distinguish Cmm bacteria and those are considered as unique markers (Paret et al., 2010). We can also see that there are several other wavenumbers of very week intensity having correlation peaks for principal components PC1, PC8, and PC9; however, due to Raman signals are naturally weak, the use of nanoparticles to enhance signals (Surface Enhance Raman Spectroscopy) (Wang et al., 2016) will probably be required in future work.
Such spectral features helped PCA+LDA to achieve a performance of 100% on the classification metrics employed. On the other hand, PCA+KMeans do not assign discriminant weights to principal components, which implies that it gives all the principal components exactly the same importance, even if they are not correlated with specific bands associated to Cmm, thus metrics show a poorer performance for PCA+KMeans with respect to PCA+LDA (Table 3). Note that for PCA+LDA, being a supervised method, it is required to separate the dataset into training and testing samples, and to have a previous knowledge of the corresponding labels for the training set. While PCA+KMeans losses accuracy at the identification of Cmm based on Raman spectrum of samples, it still important to consider it, because it has the advantage of being an unsupervised method. This characteristic makes PCA+KMeans convenient for circumstances when there are very few samples for the separation into training and testing sets, or when there are no previous knowledge about the samples, which makes impossible to assign labels for a training set in such cases.
The development of readily available, reliable and fast procedures to detect phytopathogens could raise the efficiency of sampling and search procedures (Fletcher et al., 2006; Vallejo et al., 2016). Diagnosis by way of conventional procedures can take one day, but it generally takes a lot longer, depending on the bacterium in question; furthermore, in the event of an epidemic when it is necessary to process a lot of samples at once, conventional procedures can be unaffordable. Thereby the importance of the present study as we demonstrated the usefulness of the Micro-Raman spectroscopy as a fast and efficient method for the preliminary identification of Cmm, whose detection may otherwise be difficult in culture media due to the abundant growth of saprophytes (endophytic bacteria), in accordance with Paret et al. (2010).
Acknowledgments
The present research was supported by The National Council of Science and Technology (CONACYT) through the Cátedras-CONACyT program. The authors would like to thank to the company Agriestrella S.A de C.V. and his research manager Ing. Tomas Alejandre Aumada for facilitating the strain of Clavivacter michiganensis subsp. michiganensis through the National Center of Genetic Resources (CNRG-INIFAP). This work was partially supported by CONACYT-SEP project number 236066. The technicians Lic. Álvarez Preciado L.G., and Q.F.B. Estrada Loredo Sarahi J., thanks for their support during the laboratory activities.