Application of Numerical Weather Prediction Data to Estimate Infection Risk of Bacterial Grain Rot of Rice in Korea
Article information

Abstract
This study was conducted to evaluate usefulness of numerical weather prediction data generated by the Unified Model (UM) for plant disease forecast. Using the UM06- and UM18-predicted weather data, which were released at 0600 and 1800 Universal Time Coordinated (UTC), respectively, by the Korea Meteorological Administration (KMA), disease forecast on bacterial grain rot (BGR) of rice was examined as compared with the model output based on the automated weather stations (AWS)-observed weather data. We analyzed performance of BGRcast based on the UM-predicted and the AWS-observed daily minimum temperature and average relative humidity in 2014 and 2015 from 29 locations representing major rice growing areas in Korea using regression analysis and two-way contingency table analysis. Temporal changes in weather conduciveness at two locations in 2014 were also analyzed with regard to daily weather conduciveness (Ci) and the 20-day and 7-day moving averages of Ci for the inoculum build-up phase (Cinc) prior to the panicle emergence of rice plants and the infection phase (Cinf) during the heading stage of rice plants, respectively. Based on Cinc and Cinf, we were able to obtain the same disease warnings at all locations regardless of the sources of weather data. In conclusion, the numerical weather prediction data from KMA could be reliable to apply as input data for plant disease forecast models. Weather prediction data would facilitate applications of weather-driven disease models for better disease management. Crop growers would have better options for disease control including both protective and curative measures when weather prediction data are used for disease warning.
Plant disease forecast models are commonly driven by weather factors such as temperature, rainfall, leaf wetness duration and relative humidity (Duthie, 1997; Fernandes et al., 2014; Huber and Gillespie, 1992; Lalic et al., 2016). In general, weather-driven models require hourly and/or daily weather data to identify conditions for infection (Kang et al., 2010; Magarey et al., 2005) or to simulate one or more processes in disease cycle (De Wolf and Isard, 2007; Do et al., 2012; González-Domínguez et al., 2014; Olatinwo and Hoogenboom, 2014; Park et al., 1997). By using observed weather data from automated weather stations (AWS) at near real-time basis, the models are able to determine if weather conditions favorable for pathogen infection have occurred in the immediate past period. The information generated by the models is not on what is going to happen in the future, but on what has happened in the past. However, the model output is interpreted as forecast on future appearance of disease symptoms after an incubation period of pathogen in the infected host plant (Orlandini et al., 2017). Consequently, post-infection treatments shall be taken when disease forecast information is produced based on observed weather data, and disease control measures should have curative effects to hinder pathogen growth in host plant tissues. In this regard, weather prediction data would facilitate applications of weather-driven disease models for better disease management. Crop growers would have better options of disease control tactics when weather forecast data are used for disease warning. For example, pre-infection treatments such as applying protective fungicides and cultural practices would be possible in this case. Pre-infection treatments are often more effective than post-infection treatments in terms of control cost and fungicide resistance suppression (Chakraborty et al., 2004; Gleason et al., 2008).
Although the advantages of using weather prediction data in plant disease forecast have been recognized in the literature (Magarey et al., 2001; Orlandini et al., 2017; Russo, 2000), there are still limited researches on application of numerical weather prediction models in integrated pest and disease management (Bourke, 1970; Branislava et al., 2007; Bregaglio et al., 2011; Hirschi et al., 2012; Mihailović et al., 2001).
The present study investigated the usefulness of numerical weather prediction data generated by the Unified Model (UM) in plant disease forecasting. The UM is a numerical weather prediction and climate modeling software originally developed by the United Kingdom Met office (Brown et al., 2012). Since 2010, the Korea Meteorological Administration (KMA) has been using UM along with various global and local climate models and data assimilation systems to generate weather forecast information for public services (Kim et al., 2015). The KMA executes the UM-embedded Local Data Assimilation and Prediction System (LDAPS) four times a day and releases hourly weather prediction data for 36 h at 0000, 0600, 1200, and 1,800 Universal Time Coordinated (UTC). The model runs at the horizontal resolution of 1.5 km for 70 vertical layers. The UM-data has horizontal grids of 602 East-West × 781 South-North, each of which contains data of 136 hourly prognostic variables. In this study, we used BGRcast, a weather-driven forecast model for bacterial grain rot (BGR) of rice, to evaluate usefulness of the UM-predicted weather data as input for plant disease forecast models. BGR of rice, which is caused by Burkholderia glumae (Kurita, 1967), has been reported worldwide (Ashfaq et al., 2017; Ham et al., 2011; Jeong et al., 2003; Kim et al., 2010; Nandakumar et al., 2009; Webster and Gunnell, 1992). The BGRcast was developed by Lee et al. (2015) to estimate conduciveness of weather conditions for BGR development and to provide rice growers with disease warnings that could be used in decision-making for bactericide sprays at the pre- and post-heading stages of rice plants.
Materials and Methods
Disease forecast model
The BGRcast uses conduciveness of weather conditions for BGR development as disease risk factor that measures likeliness of bacterial inoculum buildup (Cinc) and infection (Cinf) at the pre- and late-heading stages of rice, respectively (Lee et al., 2015). With the base temperature and relative humidity being 22°C and 80%, respectively, the disease risk thresholds adopted in BGRcast were Cinc=0.3 and Cinf=0.5. The base relative humidity and temperature used in BGRcast were determined by Lee et al. (2015) based on the field observations that BGR was often detected when daily minimum temperature was ≥22°C and daily average relative humidity was ≥80%. When Cinc and Cinf are above the thresholds, disease warnings are made to advise bactericide sprays at the pre- and late-heading stages of rice, respectively. Consequently, the fixed two-spray scheme, which Korean rice growers commonly adopt to control BGR, can be improved by eliminating unnecessary sprays depending on the BGRcast forecast.
Observed crop and weather data
The BGRcast requires heading dates of rice cultivars to estimate environmental conduciveness for bacterial inoculum build-up prior to the panicle emergence and infection during the panicle heading period. In this study, crop data on cultivars and heading dates of rice grown at 29 rice paddy fields in 2014 were collected from the National Crop Pest Management System (NCPMS) of the Rural Development Administration of Korea. Heading dates of 14 rice cultivars at 29 rice paddy fields were given with the location data in Table 1. The rice heading dates varied depending on cultivars and locations with different weather conditions. The heading date was defined to be the date that approximately 40% of rice panicles were emerged (Lee et al., 2015).

Heading dates of rice varieties cultivated at 29 locations in 2014, geographical locations of paddy fields and distances from the paddy fields to the nearest automated weather stations
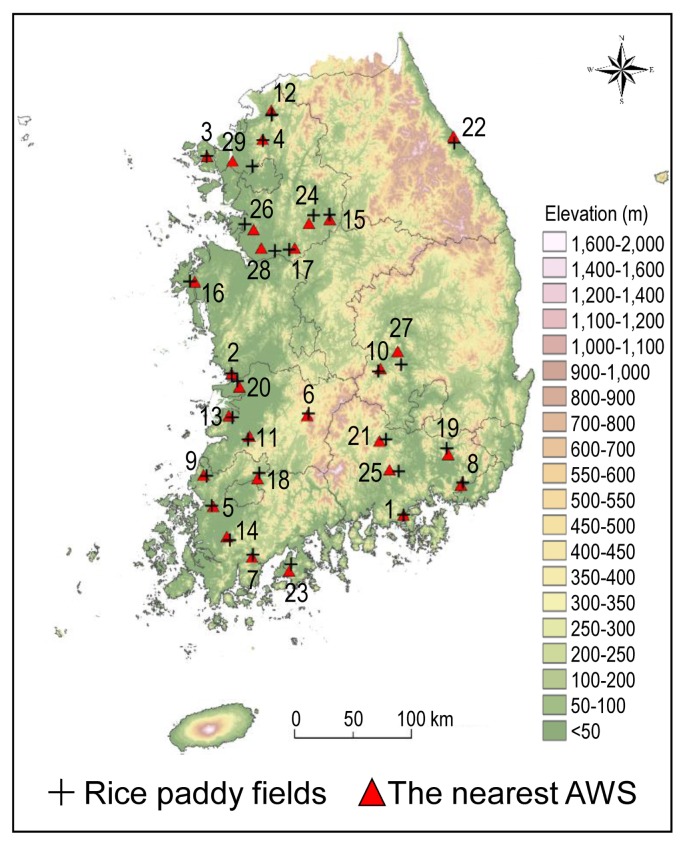
The observed daily minimum temperature and average relative humidity data in 2014 and 2015 were collected from the automated weather observation network of KMA. Based on the longitude and latitude of the 29 paddy fields, the nearest AWS from individual paddy fields were identified. The distance between the paddy fields and their nearest AWS were in the range of 0.04–17.67 km (Table 1). The site ID denoted the ascending order of the distance from the rice paddy fields to their nearest AWS. The geographical locations of rice paddy fields and nearest AWS were displayed in Fig. 1. The data collection sites for rice heading dates and weather conditions were distributed in the major rice growing areas throughout the country, and their ground elevation varied in the range of 0 to 327 m for rice paddy fields and 6 to 353 m for weather stations.
Weather prediction data
Daily weather prediction data to be used as input for BGRcast were generated by LDAPS utilizing the ‘UM release version 8.2’ (Lee and Chun, 2015). Of the four sets of weather prediction data released at different times, we used the UM-data released at 0600 (UM06) and 1800 (UM18) UTC to generate 2-day disease forecast by BGRcast on the conduciveness of weather conditions for BGR development. Because the Korea Standard Time (KST) is 9 hours ahead of UTC, UM18 and UM06 were released at 0300 and 1500 KST during a day, respectively. Consequently, hourly weather prediction data for 0000–0200 KST from UM18 of yesterday and for 0300–2300 KST from UM18 of today were used to forecast today’s disease risk. In order to forecast tomorrow’s disease risk, hourly weather prediction data for 0000–2300 KST from UM06 were used. The UM data in GRIB2 file format were converted to generic text files using the KWGRIB2 software which was developed by KMA to extract weather prediction data. Hourly weather prediction data by UM in 2014 and 2015 were retrieved from KMA to run BGRcast in this study.
Evaluation of daily weather prediction data
Accuracy of daily weather prediction data from UM for the locations of 29 paddy fields was evaluated by comparing with the observed daily weather data from corresponding locations in 2014 and 2015. Daily minimum temperature and average relative humidity during May 5 to October 31, 2014 and 2015 were used to compare the UM-predicted and the AWS-observed data using regression analysis. The absolute differences between the UM-predicted and the AWS-observed data and their root mean square error (RMSE) in daily minimum temperature were calculated from 10,411 data points ([(180 days in 2014) + (179 days in 2015)] × 29 sites) to examine the magnitude and variability of the differences. In the case of daily average relative humidity, differences between the predicted and the observed data and their RMSE were examined using 10,380 data points. There were missing relative humidity data for 31 days. The two-way contingency table analysis (Sokal and Rohlf, 1973) on the UM-predicted and the AWS-observed relative humidity was carried out to investigate the impact of input weather data on the disease warnings by BGRcast. A total of 10,380 data points were categorized into four groups with reference to 80% relative humidity, which is the threshold of relative humidity for BGR development. The appropriateness of daily weather prediction data as meteorological inputs was evaluated based on the coefficient of determination (R2) and RMSE values. The ‘SciPy’ and ‘Pandas’ packages in Python version 3.7 (Python Software Foundation, Wilmington, DE, USA) were used to perform the regression analysis and RMSE calculation.
Verification on use of the UM-predicted weather data
The UM-based BGR forecast was verified in three ways. Firstly, relationships between the UM-based and the AWS-based estimates of Cinc and Cinf were examined by regression analysis. Secondly, the two-way contingency table analysis was conducted to evaluate concurrence of the BGRcast warnings from the UM-based and the AWS-based disease forecasts for all 29 locations in Table 1. Thirdly, temporal changes in the UM-based estimates of Ci, Cinc, and Cinf were compared with the AWS-based estimates over the rice growing season for two locations in 2014. We selected two locations in consideration of the distance to their nearest AWS and the BGRcast warnings. In this analysis, we used only the UM06 data as input for BGRcast in order to avoid redundancy. For the first and second verification tests, we used weather data from 2014 and 2015, and calculated Cinc and Cinf assuming that heading dates of rice plants varied from July 15 to September 9. For the third verification tests, we used weather data only from 2014 since the heading dates of rice cultivars in Table 1 were not available for 2015. Without heading date data, it is not possible to delineate the periods of inoculum build-up and infection phases of the bacteria during the rice growing season (Lee et al., 2015). The disease risk thresholds of Cinc and Cinf for BGRcast warnings were 0.3 and 0.5, respectively, as suggested by Lee et al. (2015).
Results
Evaluation of daily weather prediction data
The regression analysis in Fig. 2 indicated that the UM-predicted and the AWS-observed daily minimum temperature appeared similar to each other in both cases of UM06 and UM18. The coefficient of determination (R2) of regression equations was approximately 0.9, and the regression coefficients were close to 1.0. The absolute mean differences between the observed and the predicted daily minimum temperatures were less than 2°C in the most locations except Site 22, which is an East coast area of South Korea (Fig. 3). The differences were a little greater for UM18 than for UM06 as was indicated by RMSE.
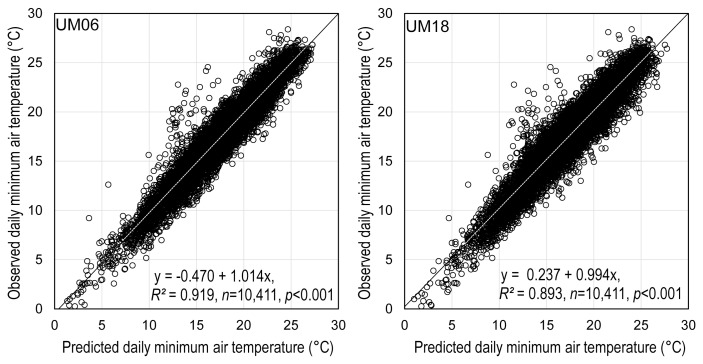
The relationship between the Unified Model (UM)-predicted and the automated weather stations-observed daily minimum temperature at 29 locations of paddy fields during the period from May 5 to October 31 in 2014 and 2015. The UM-predicted weather data for one day at all 29 locations were missing in the plot. UM06, UM-data released at 0600 Universal Time Coordinated (UTC); UM18, UM-data released at 1800 UTC.
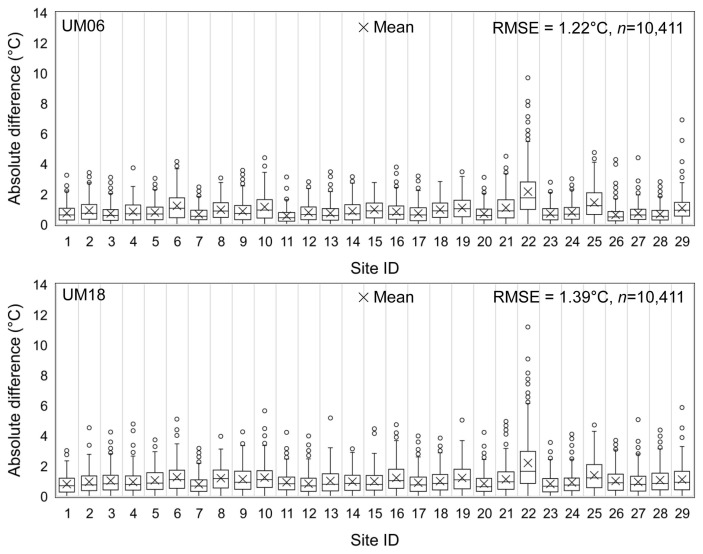
The absolute differences between the Unified Model (UM)-predicted and the automated weather stations-observed daily minimum temperature at each location of rice paddy field during the period from May 5 to October 31 in 2014 and 2015 and the root mean squared error (RMSE) of the differences. The UM-predicted weather data for one day at all 29 locations were missing in the plot. UM06, UM-data released at 0600 Universal Time Coordinated (UTC); UM18, UM-data released at 1800 UTC.
As for daily average relative humidity, the regression equations between the UM-predicted and the AWS-observed were statistically significant for both UM06 and UM18 (Fig. 4). However, R2’s and the scatter plots indicated that the relationship between the observed and the predicted daily average relative humidity were not as similar to each other as in the case of daily minimum temperature. The differences between the UM-predicted and the AWS-observed daily average relative humidity varied widely and RMSE for the differences was almost 10% (Fig. 5). The overall patterns of differences between the UM-predicted and the AWS-observed daily average relative humidity across the 29 locations appeared similar for UM06 and UM18. The difference in relative humidity was particularly high in the case of Site 22.

The relationship between the Unified Model (UM)-predicted and the automated weather stations (AWS)-observed daily average relative humidity at 29 locations of paddy fields during the period from May 5 to October 31 in 2014 and 2015. The AWS-observed relative humidity data for 31 days at all 29 locations were missing in the plot. UM06, UM-data released at 0600 Universal Time Coordinated (UTC); UM18, UM-data released at 1800 UTC.
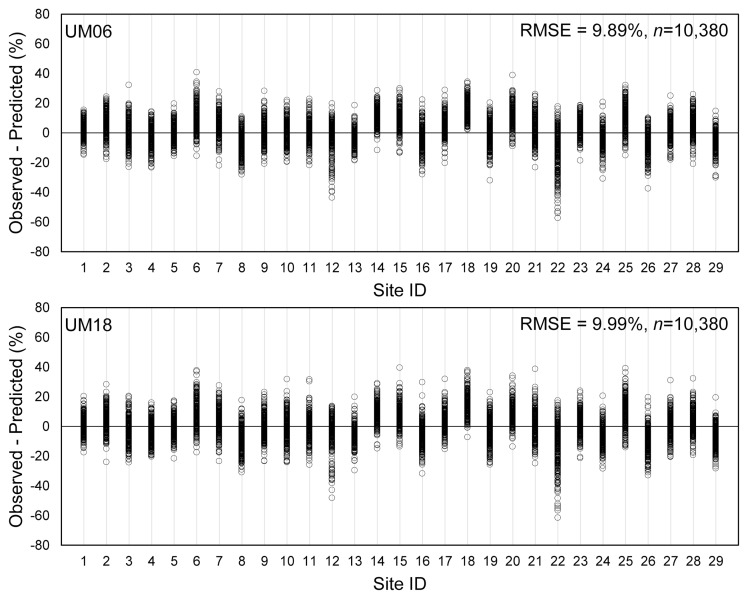
The differences between the Unified Model (UM)-predicted and the automated weather stations (AWS)-observed daily average relative humidity at each location of rice paddy field during the period from May 5 to October 31 in 2014 and 2015 and the root mean squared error (RMSE) of the differences. The AWS-observed relative humidity data for 31 days at all 29 locations were missing in the plot. UM06, UM-data released at 0600 Universal Time Coordinated (UTC); UM18, UM-data released at 1800 UTC.
Results of two-way contingency table analysis on concurrence of the UM-predicted and the AWS-observed daily average relative humidity were graphically presented with reference to the threshold of relative humidity in Fig. 6. The threshold of daily average relative humidity was 80% as suggested by Lee et al. (2015). When the threshold was used as a criterion for categorization of the relationship between the UM-predicted and the AWS-observed data, the probability of detection (POD) and the false alarm ratio (FAR) by the UM06 were 58.4% and 29.2%, respectively. As for UM18, they were 63.5% and 33.6%, respectively. In this analysis, POD and FAR are the percent detection and false-detection, respectively, of the AWS-observed relative humidity of ≥80% by the UM-predicted.

Graphic presentation of the two-way contingency table analysis on the Unified Model (UM)-predicted and the automated weather stations (AWS)-observed daily average relative humidity (RH) at 29 locations of paddy fields during the period from May 5 to October 31 in 2014 and 2015. Data points were categorized into four groups with reference to 80% RH, which is the threshold of relative humidity for bacterial grain rot development. UM06, UM-data released at 0600 Universal Time Coordinated (UTC); UM18, UM-data released at 1800 UTC.
Verification on use of the UM-predicted weather data
The relationships between the UM-based and the AWS-based estimates of Cinc and Cinf were presented in Fig. 7. The regression coefficients for all four graphs were close to 1.0 with the intercept being approximately 0.0, suggesting that use of the UM-predicted weather data as input for BGRcast would result in Cinc and Cinf that are similar to the model outputs produced by using the AWS-observed weather data as input. The R2’s were higher for both Cinc and Cinf when the UM06-predicted data were used (Fig. 7A and C) than the UM18-predicted data (Fig. 7B and D). It was also found that R2’s for Cinf (Fig. 7C and D) was higher than for Cinc (Fig. 7A and B) in both cases of using the UM06- and the UM18-predicted weather data as input for BGRcast.
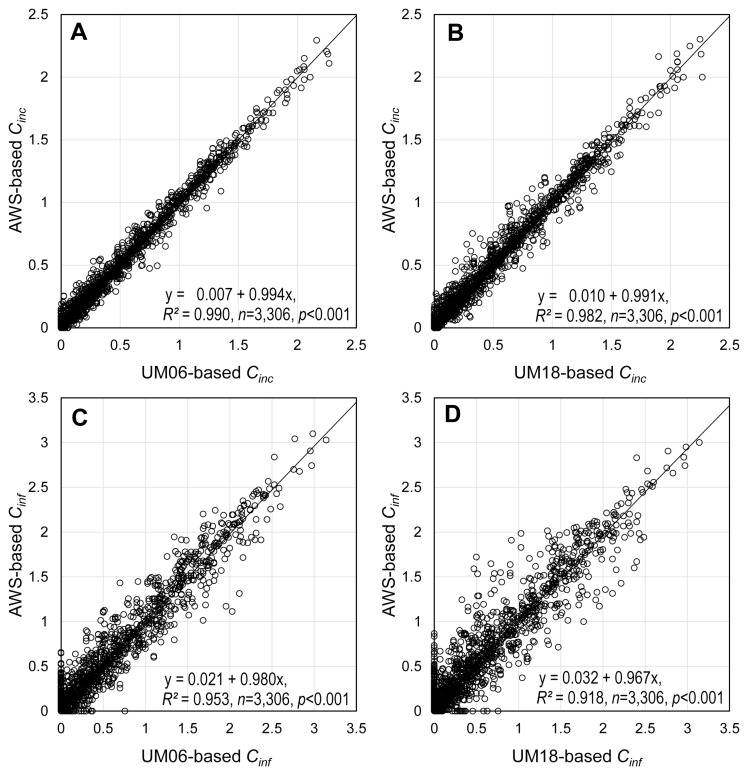
The relationships between the Unified Model (UM)-based and the automated weather stations (AWS)-based estimates of Cinc and Cinf, which were calculated assuming that heading dates of rice plants varied from July 15 to September 9. Weather data for the period from May 5 to October 31 in 2014 and 2015 were used to run BGRcast. (A) UM06-based Cinc vs. AWS-based Cinc. (B) UM18-based Cinc vs. AWS-based Cinc. (C) UM06-based Cinf vs. AWS-based Cinf. (D) UM18-based Cinf vs. AWS-based Cinf. UM06, UM-data released at 0600 Universal Time Coordinated (UTC); UM18, UM-data released at 1800 UTC.
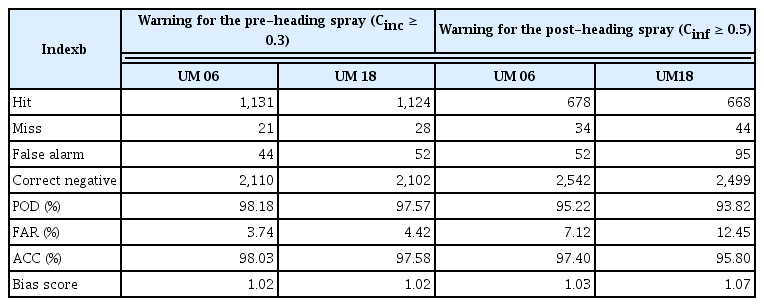
Results of the two-way contingency table analysis on concurrence of BGRcast warnings from the UM-based and the AWS-based disease forecasts were presented in Table 2. A total of 3,306 cases (57 days × 29 locations × 2 years) were included in the analysis by using weather data from 2014 and 2015 with varying heading dates of rice plants from July 15 to September 9. As compared with the AWS-based disease warnings for the pre-heading spray, the UM06-based BGRcast was able to provide the same disease warnings at 98.18% POD, and issue incorrect disease warnings at 3.74% FAR. Regarding disease warnings for the post-heading spray, POD and FAR were 95.22% and 7.12%, respectively. In general, the UM06 and UM18-predicted weather data resulted in almost the same outputs on Cinc and Cinf with negligible differences. The accuracy and bias score indices indicated that both the UM-based and the AWS-based disease forecasts by BGRcast would provide almost the same outputs.
Using the heading dates and the AWS-observed weather data at 29 locations in 2014, Cinc and Cinf were estimated by BGRcast for the inoculum build-up and infection phases, respectively (Table 3). Durations of the inoculum build-up phase and the infection phase were determined with reference to the observed heading dates of rice cultivars. As was defined by Lee et al. (2015), the infection phase spans 7 days during the period between 3 days prior to and 3 days posterior to the heading date. The inoculum build-up phase extends over 20 days before the panicle emergence, which is the staring day of the infection phase. A warning for the pre-heading spray was advised on the last day of inoculum build-up phase if Cinc ≥0.3, which is the threshold for disease risk. In this study, none of 29 locations had a warning for the post-heading spray because Cinf on the last day of the infection phase at all locations was less than the threshold of Cinf, which is 0.5. Based on disease warnings that were advised by BGRcast using the AWS-observed weather data, 29 locations were categorized into two disease warning groups (Table 3). The first group includes 14 locations where both Cinc and Cinf were not reached their thresholds and no disease warnings were advised. The second group of 15 locations had a pre-heading warning with Cinc ≥0.3. None of 29 locations had only a post-heading warning or both pre- and post-heading warnings when the AWS-observed weather data were used as input data for BGRcast.
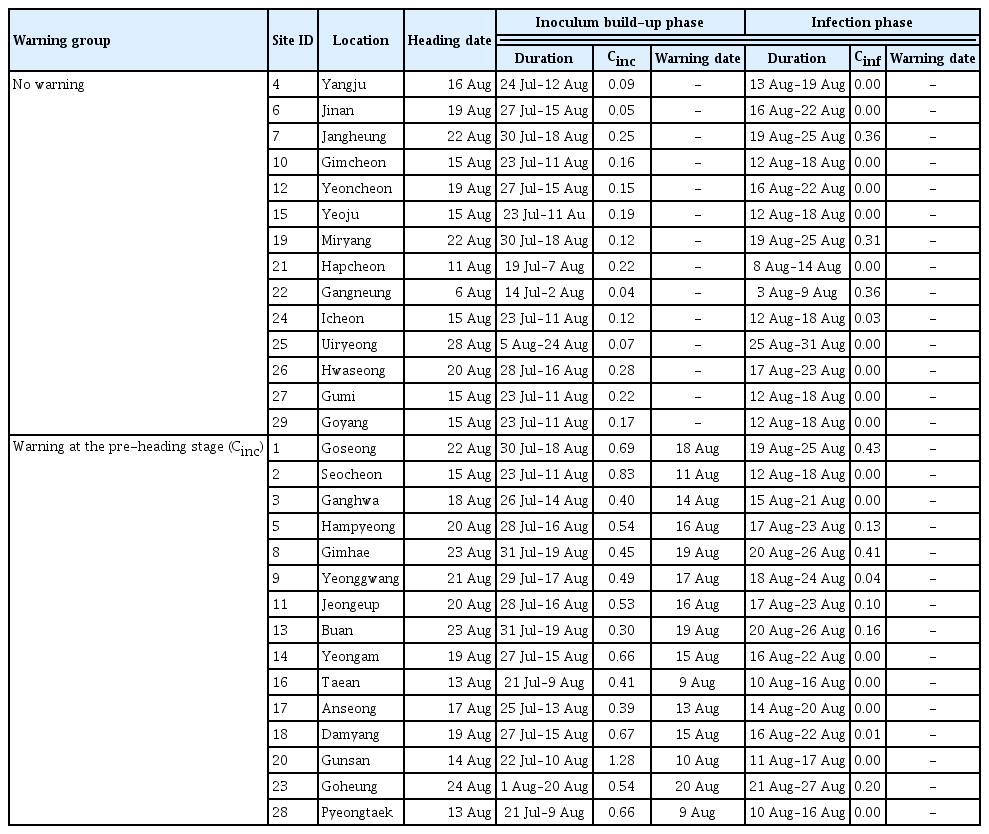
The BGRcast-estimated conduciveness of weather conditions during the inoculum build-up phase (Cinc) and the infection phase (Cinf), and dates of warning based on the conduciveness for bacterial grain rot development at 29 locations of rice paddy fields in 2014
Temporal changes of Ci, Cinc and Cinf over the rice growing season in 2014 were examined for two locations, Yangju and Goseong, representing each of the two disease waring groups (Fig. 8). The two locations had AWS for weather monitoring at the closest distance among all locations in the respective disease warning groups (Table 3). The UM06-predicted and the AWS-observed weather data resulted in different daily weather conduciveness (Ci). However, there were not much differences in the moving averages of Ci for 20 days of the inoculum build-up phase (Cinc) and for 7 days of the infection phase (Cinf) between the outputs of BGRcast using the UM06-predicted and the AWS-observed weather data. The daily weather conduciveness (Ci) suggested that weather conditions in 2014 were more favorable for BGR development at Goseong than Yangju. In Yangju, the UM06-based Cinc over the inoculum build-up phase during July 24–August 12 was ≤0.12, and the UM06-based Cinf over the infection phase during August 13-August 19 was 0.00. In the case of Goseong, the UM06-based Cinc during July 30–August 18 and the UM06-based Cinf during August 19–August 25 ranged 0.42–1.04 and 0.08–0.32, respectively.
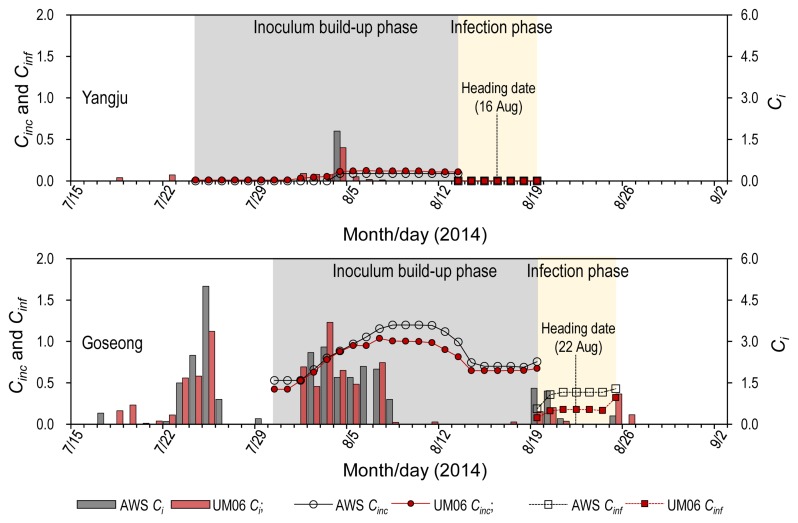
Temporal changes of Cinc and Cinf over the rice growing season in 2014 for two locations, Yangju and Goseong. The automated weather stations (AWS)-observed (gray) and the UM06-predicted (red) weather data were used as input data for BGRcast to estimate Ci, Cinc and Cinf.
Discussion
It was found that the UM-predicted weather data would be as useful as the AWS-observed weather data for disease forecast by BGRcast. Even though the differences between the UM-predicted and the AWS-observed daily average relative humidity was obvious, the difference in relative humidity did not affect the BGRcast output significantly as was shown in Fig. 7. This was due to the fact that BGRcast adopted 80% relative humidity as the threshold for estimating conduciveness of weather conditions (Lee et al., 2015). The two-way contingency table analysis with reference to the threshold of daily average relative humidity in Fig. 6 suggested that approximately 75% of 10,380 data points in Fig. 5 should have resulted in no differences in the BGRcast output although the UM-predicted and the AWS-observed relative humidity were not exactly same. It is also shown in Fig. 6 that there might be approximately 13–15% and 9–12% chances of missing and false warnings, respectively, on disease risk by BGRcast. However, the chances of miss-forecasting by BGRcast could be reduced in reality because of the temperature threshold in the model. For example, when daily minimum temperature is lower than 22°C, BGRcast would not advise disease risk warnings even if daily average relative humidity were higher than 80%. The results from BGRcast suggested possible use of the UM-predicted weather data for plant disease forecast in general even if accuracy of disease forecast may vary depending on the sensitivity of disease forecast models to weather variables.
Numerical weather prediction models like UM produce gridded weather data covering a large area at a certain spatial resolution using various methods to calculate meteorological variables within the grids (Collins et al., 2013; Staniforth et al., 2014). Difference between the UM-predicted and the AWS-observed data was partially attributed to grid generation methods of UM and physical nature of meteorological variables (Cullen and Davies, 1991; Mesinger, 1981; Walters et al., 2019). The UM that was used in this study has 470,162 grid points at the spatial resolution of 1.5 km × 1.5 km covering the Korean Peninsula. Unlike other sites in Table 1, Site 22 (Gangneung) is a coastal area at the distance of only 332m from the East Sea. The UM-grid cell encompassing Site 22 covers the area which consists of both ocean and inland. The geographical location of Site 22 probably has caused the particularly large differences between the UM-predicted and the AWS-observed weather data, especially relative humidity, as compared with other locations. The R2’s of the regression equations in Fig. 7 indicated that the UM06-predicted weather data were generally more accurate than the UM18 when compared with the AWS-observed weather data. Since Cinc is the 20-day moving average of the daily conduciveness of weather conditions (Ci), the relationship between the UM-based and the AWS-based BGRcast showed higher R2 for Cinc than Cinf, which is the 7-day moving average of Ci (Fig. 7). Based on the results from the regression analyses in Fig. 7, the UM-based BGRcast would be as good in estimating Cinc and Cinf as the AWS-based BGRcast. Furthermore, the two-way contingency table analysis in Table 2 showed the disease warnings based on the UM-predicted weather data were highly concurrent with the warnings based on the AWS-observed weather data.
It was suggested by Lee et al. (2015) that Cinc and Cinf estimated by BGRcast could be used as a disease risk factor for determining whether or not to spray bactericides at the pre- and post-heading stages, respectively. Based on the UM06-based BGRcast warnings, there was no need for bactericide sprays at both the pre- and post-heading stages at Yangju, whereas only the pre-heading spray was necessary at Goseong. Although the AWS-based BGRcast resulted in slightly higher Cinc and Cinf at Goseong than the UM-based BGRcast, disease warnings for bactericide sprays should have been the same regardless of the sources of weather data for both Goseong and Yangju in 2014. By using the UM-predicted weather data, it was possible to forecast possible risk of BGR two days earlier than when the AWS-observed weather data were used as input data for BGRcast.
In conclusion, it was found in this study that the UM-predicted weather data released by KMA were useful for their use in plant disease forecast. The UM-predicted weather data could be applicable to various disease forecast models other than BGRcast. A major advantage of using the numerical weather prediction data is that disease forecast information should be available prior to actual infection by pathogen (Firanj Sremac et al., 2018), which allows crop growers to take better options of disease control measures including both protective and curative chemicals (Beresford and Manktelow, 1994). By incorporating protective measures in plant disease management, it is possible to suppress development of fungicide resistance in pathogen population (Darolt et al., 2016; Hollomon, 2015; Horsfield et al., 2010). Besides, the UM-predicted weather data are available free of charge (Magarey and Isard, 2017) throughout the whole country of Korea at the spatial resolution of 1.5 km × 1.5 km.
Acknowledgments
This work was funded by the Korea Meteorological Administration Research and Development Program under Grant KMI2018-04511.