Comparison of Microbial Community of Rhizosphere and Endosphere in Kiwifruit
Article information
Abstract
Understanding the microbial community and function are crucial knowledge for crop management. In this study, bacterial and fungal community structures both rhizosphere and endosphere in kiwifruit were analyzed to gain our knowledge in kiwifruit microbiome. Microbial community in rhizosphere was less variation than endosphere community. Functional prediction results demonstrated that abundance of saprotrophic fungi was similar in both rhizosphere and endosphere, but potential pathogenic fungi was more abundance in endosphere than in rhizosphere. This finding suggested that maintain healthy soil is the first priority to protect the host plant against biotic stresses.
Plants have association with enormous microbial organisms and concept of holobiont comprises the host plant and its associated microbiota including bacteria, archaea, and fungi (Vandenkoornhuyse et al., 2015). Therefore, conventional ‘the disease triangle’ in plant pathology discipline has include microbiota as a factor in the disease management strategy. Metagenomic approach has made possible to unraveling both culturable and unculturable microbes as well as define microbial community structure. Phytobiome can be divided into rhizospheric, phyllospheric, and endophytic microbes depending on the host plant tissue parts (Quiza et al., 2015). Ottesen et al. (2013) provided a basic description and several distinctive of tomato microbiota. Their results indicated the distinct microbial groups with different plant tissue compartments and similar correlation to the distance from the soil. Cregger et al. (2018) also provided holistic microbial structures in eastern cottonwood (Populus deltoides) as the model perennial plant. Community structure of fungi, bacteria, and archaea were primarily varied to plant compartments regardless of the cottonwood genotypes. In comparison microbial structure in domestic and imported kiwifruit pollens, the imported pollens showed the lower diversity than the domestic pollens but a bacterial canker pathogen, Pseudomonas syringae pv. actinidiae, was only detected in the imported pollen (Cho et al., 2018). Up to now, only limited information in kiwifruit microbiome is available, therefore, we compared rhizosphere and endosphere microbial communities in kiwifruit.
Experimental kiwifruit trees (cv. Deliwoong, 10 years olds) were designated in Namhae Fruit Tree Genetic Resource Center in Republic of Korea (34°48′56.8″N, 127°55′42.7″E). Respective samples of rhizosphere soil and sap were collected from the three independent trees as replications. Rhizosphere soil was collected from main root and rootlet (depths between 25 to 40 cm) by a trowel and a brush into 50 ml conical tubes on March 24, 2017 (daily temperature 9.3 ± 4°C and a relative humidity of 68.8%). Sap was taken by drilling trunks and securing the taps into 50 ml conical tubes on April 24, 2017 (temp. 15.9 ± 6°C and relative humidity of 28.8%). DNA of Rhizosphere soil (10 g) and sap (10 ml) were extracted using Power-Max soil DNA isolation kit (Qiagen, Hilden, Germany) by three repetitions. Internal transcribed spacer (ITS) and 16S rRNA libraries were sequenced by Macrogen Co. (Seoul, Korea) with Illumina Miseq 250 paired end platform. Primers ITS3 (TCGTCGGCAGCGTCAGATGTGTATAAGAGACAGGCA TCGATGAAGAACGCAGC) and ITS4 (GTCTCGTGGGCTCGGAGATGTGTATAA GAGACAGTCCTCCGCTTATTGATATGC) for fungal ITS library, 341F (CCTACGGGNGGCWGCAG) and 805R (GACTACHVGGGTATCTAATCC) for bacterial 16S rRNA libraries were employed. Raw sequences were processed quality control and clustering to operational taxonomic units (OTUs) by R version 3.5.2 package DADA2 version 1.10 (Callahan et al., 2016). Base on DADA2 guideline (https://benjjneb.github.io/dada2/index.html), 16S rRNA libraries without reverse reads were tunicate to 220 bp according to Phred quality score of 30 or higher and the ITS libraries were not truncated in consideration of length variation depending on fungal diversity. The truncated and non-truncated each sequence were clustered to OTUs with divisive amplicon denoising algorithm (DADA) (Callahan et al., 2016) and removed chimera. The OTUs were assigned taxonomy by Silva version 132 (Quast et al., 2012) for bacteria and UNITE version 8.0 (Kõljalg et al., 2013) for fungi. The bacterial OTUs reads were normalized based on known 16S rRNA copy and predicted enzyme activity and metabolic pathway using PiCRUSt2 version 2.0.4-b (Langille et al., 2013) which re-developed version of PiCRUSt. Fungal OTUs were predicted functional groups by FUNGuild version 1.1 (Nguyen et al., 2016). The metagenomic analyses were performed with R package phyloseq version 1.22.3 (McMurdie and Holmes et al., 2013) and DEseq2 version 1.22.2 (Love et al., 2014). Each graph of metagenomic analysis was visualized by ggplot2 version 3.1.0 in R (Wickham, 2016).
Illumina sequencing data revealed 467,735 and 1,008,735 filtered read numbers for fungi and bacteria, respectively (Supplementary Table 1). Rarefaction curve of each sample in both bacteria and fungi was satisfied to analyze the microbial communities (Supplementary Fig. 1). Principal coordinates analysis and α-diversity showed that rhizosphere community had a relatively similar structure than those of endosphere (Figs. 1 and 2). Both bacteria and fungi diversities were also observed more variation in the endosphere than the rhizosphere. Among top fungal genera, all fungi were assigned into 3 phyla (Table 1) and Ascomycota (63%), Mortierellomycota (21%), and Basidiomycota (11%) were detected in both rhizosphere and endosphere of kiwifruit. Abundance bacterial family also were classified into 3 phyla, including Proteobacteria (51%), Actinobacteria (16%), and Firmicutes (13%) (Table 2). As expected diversity of kiwifruit microbiota, the rhizosphere community showed more microbial diversity than endosphere in both bacteria and fungi (Supplementary Fig. 2). Additionally, shared OTUs between rhizosphere and endosphere presented that only small group of microbes were existed in both rhizospheric soil and sap. This finding suggested that among numerous microbes in rhizosphere, certain microbes may enter into the endosphere as either entophytic or invasion pathogen. List of common fungal OTUs in both rhizosphere and endosphere (Supplementary Table 2), Didymella bellidis and Cladosporium cladosporioides were detected in rhizosphere as 1.8% and 0.4%, respectively. However, abundancy of D. bellidis and C. cladosporioides in sap were 16% and 8.1%, respectively. D. bellidis was previously classified as Phoma beliidis, which is well known the plant pathogenic fungus with wide host range as well as it is one of ubiquitous fungus worldwide (Chen et al., 2015; Montel et al., 1991). C. cladosporioides has been studied intensively because the fungus is an endophyte in Taxus brevifolia, taxol producing tree, a famous anti-cancer drug (Miao et al., 2018). C. cladosporioides is an endophytic fungus not only tree but also marine alga, and an recent discovering reported that the fungus biogenic synthesized even gold nanoparticles (Hulikere et al., 2017). Qin et al. (2016) reported that C. cladosporioides can promote plant seed germination and growth. The fungus was detected at all part of American sweetgum plant tissues, including rhizosphere, phyllosphere, and endosphere. Torres et al. (2017) observed and verified that C. cladosporioides suppressed rust disease occurrence due to antagonistic and hyperparasitic effects of the fungus against the pathogen. Assignment of functional guild using FUNGuild revealed difference between rhizosphere and endosphere fungal population (Fig. 3, Supplementary Fig. 3). Abundance of saprophytic fungi was no difference between rhizosphere and endosphere. However, abundance of pathotroph mode fungi were significantly higher in the sap than the rhizosphere. The finding suggested that putative pathogenic fungi may actively invade the plant through root system from rhizosphere.
Principal coordinates analysis (PCoA) based on Bray-Curtis distance. Sap and rhizosphere samples (A) and sap samples (C) only at the operational taxonomic units (OTUs) level show theirs distance of fungal and bacterial composition similarity. Dots representing OTUs for sap and rhizosphere (B) and sap only sample (D) show that each OTU closer to the sample position in PCoA contributes more. The red, green, and blue OTU dots mean fungal genus Didymella, bacterial genus Pseudomonas and Streptomyces.
Relative abundance at family level. Unitedness of bacterial abundance (A) and fungal abundance (B) are calculated to local contribution to beta diversity (LCBD).
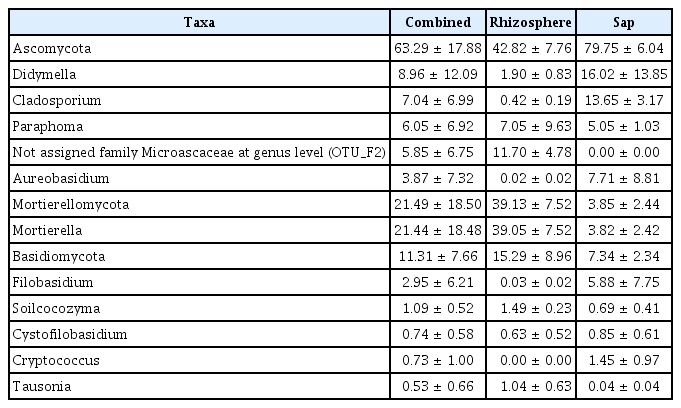
Each top 5 fungal genera in top 3 phyla component (%)
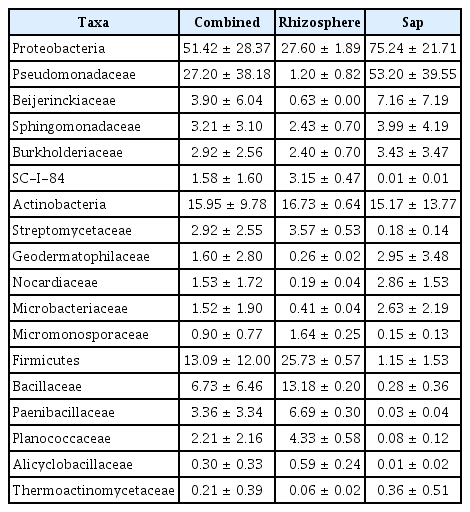
Each top 5 bacterial families in top 3 phyla component (%)
Predicted fungal trophic mode using FUNGuild. Bar heights mean average abundance (%). Their standard deviations are described by error bars.
In common bacterial OTUs in rhizosphere and endosphere, two strains were abundant in the sap than the rhizosphere. Curtobacterium sp. and Sphingomonas sp. were existed as 0.04% and 0.29% in rhizosphere, 1.22% and 0.76% in sap, respectively (Supplementary Table 3). Curtobacterium sp. is Gram-positive corynebacteria, soil inhabitant, and isolated from plant tissues including endosphere (Lumactud et al., 2016). The bacterium is also known as a potential biocontrol agent for sweet orange (Garrido et al., 2016). Sphingomonas sp. LK11, endophytic strain in Tephrosia apollinea, contributed plant growth through producing gibberellins and indole acetic acid (Khan et al., 2014). The LK11 stain also significantly enhanced tomato growth. KEGG BRITE mapping results presented enzymatic activities of the bacterial communities in rhizosphere and endosphere of kiwifruit (Supplementary Fig. 4). Among 41 categories of enzyme activity have been assigned and endospheric community showed higher enzymes activities than rhizospheric microbiome community. This funding suggested that although bacterial diversity and population density were less in endosphere than rhizosphere, the endosphere bacterial community much more active than rhizosphere community and the activity may relate plant growth promotion effect or protection against both biotic and abiotic stresses.
The microbial communities of kiwifruit are probably shaped by a broad variation of environmental and host-microbe related factors (Coleman-Derr et al., 2015). The rhizosphere has relatively high microbial diversity, while sap has low diversity. The fact that rhizosphere microbiome is richer than endophytes microbiome was well established (Daniel, 2005). Our findings supplemented to these general aspects in both fungal and bacterial community compositions and relationships between migration and function in the same kiwifruit tree. Phylum Ascomycota of fungi and Proteobacteria of bacteria were the most dominant groups in kiwifruit microbiome. Interestingly enough, putative pathogenic fungi and beneficial bacteria were mostly abundant groups in the shared OTUs between rhizosphere and endosphere. Bacteria and fungi competed with the effective endophytic rhizobia in the limited space and nutrients (Miao et al., 2017). The fungal endophytes have been recognized as two major groups clavicipitaceous endophytes (C-endophytes) class I and nonclavicipitaceous endophytes (NC-endophytes) class II, III, IV to differences in evolutionary relevance, taxonomy, host range and ecological functions (Rodriguez et al., 2008). Ascomycetous fungi have broad and diverse range in all the classes. Among Proteobacteria classes, α, β, and γ-Proteobacteria were reported as the most abundant bacteria in plant endophytic communities (Santoyo et al., 2016). The most commonly found endophyte genera are also rhizosphere inhabitants. Ascending migration of endophytes from roots to leaves had been demonstrated inside rice plants (Chi et al., 2005). Even though endophytic migration is adapted to specific plant genotypes, various endophytic communities are influenced by abiotic and biotic factors, such as environmental conditions, microbe-microbe interactions and plant-microbe interactions (Miliute et al., 2015). Through this kiwifruit microbiota study, results may provide a foundation for selection and development of kiwifruit growth promoting microbes or biological control agents.
Supplemental Materials
Acknowledgments
This research was supported by Next-Generation BioGreen 21 program (PJ013250) and by the 2019 R&D fund of the Animal and Plant Quarantine Agency.
Notes
Electronic Supplementary Material
Supplementary materials are available at The Plant Pathology Journal website (http://www.ppjonline.org/).