Transcriptome Analysis of Induced Systemic Drought Tolerance Elicited by Pseudomonas chlororaphis O6 in Arabidopsis thaliana
Article information
Abstract
Root colonization by Pseudomonas chlororaphis O6 induces systemic drought tolerance in Arabidopsis thaliana. Microarray analysis was performed using the 22,800-gene Affymetrix GeneChips to identify differentially-expressed genes from plants colonized with or without P. chlororaphis O6 under drought stressed conditions or normal growth conditions. Root colonization in plants grown under regular irrigation condition increased transcript accumulation from genes associated with defense, response to reactive oxygen species, and auxin- and jasmonic acid-responsive genes, but decreased transcription factors associated with ethylene and abscisic acid signaling. The cluster of genes involved in plant disease resistance were up-regulated, but the set of drought signaling response genes were down-regulated in the P. chlororaphis O6-colonized under drought stress plants compared to those of the drought stressed plants without bacterial treatment. Transcripts of the jasmonic acid-marker genes, VSP1 and pdf-1.2, the salicylic acid regulated gene, PR-1, and the ethylene-response gene, HEL, also were up-regulated in plants colonized by P. chlororaphis O6, but differed in their responsiveness to drought stress. These data show how gene expression in plants lacking adequate water can be remarkably influenced by microbial colonization leading to plant protection, and the activation of the plant defense signal pathway induced by root colonization of P. chlororaphis O6 might be a key element for induced systemic tolerance by microbes.
Root colonization by certain microbes increases plant fitness (Van Loon and Glick, 2004). Mechanisms of plant growth promotion by rhizobacteria include elimination of deleterious pathogens, increases availability of nutrients, production of phytohormones such as auxins, and cytokinins (Defago and Haas, 1990; Glick et al., 1998; Kim et al., 2011; Kloepper et al., 1980; Timmusk and Wagner, 1999) or reduction of the plant growth regulator ethylene production (Glick, 1995). Induced systemic resistance (ISR) by root colonization with nonpathogenic rhizobacteria is effective in various plants against different types of pathogens (Kloepper et al., 2004; Ramamoorthy et al., 2001; Van Loon et al., 1998).
Drought and salt tolerance in plants could be induced by root colonization of certain rhizobacteria. Induced drought and salt tolerance was observed in plants with root colonization by the endophytic fungus Piriformospora indica and Trichoderma species (Schardl et al., 2004; Waller et al., 2005). Root colonization by the gram-positive bacterium, Paenibacillus polymyxa also increases survival Arabidopsis thaliana under drought stress (Timmusk and Wagner, 1999). Drought tolerance induced by Achromobacter piechaudii has been correlated with the lowered ethylene levels due to the bacterial cells producing 1-aminocyclopane-1-carboxylate (ACC)-deaminase (Mayak et al., 2004). Pseudomonas chlororaphis O6 is one of these beneficial root colonizers. P. chlororaphis O6 root colonization reduced symptom development caused by the leaf pathogens, Erwinia carotovora and Pseudomonas syringae pv. tabaci in tobacco (Han et al., 2006; Spencer et al., 2003) and in cucumber against Corynespora leaf spot disease (Kim et al., 2004). In addition, root colonization by P. chlororaphis O6 increases leaf surface area in tobacco (Kang et al., 2006; Ryu et al., 2007) and induces tolerance to drought and salinity in Arabidopsis (Cho et al., 2008; 2011; 2012).
Previous works indicated that certain plant genes were altered upon root colonization by certain beneficial microbes. Increases in transcripts of genes involved in cell division and proliferation, but down-regulation of genes related to stress were determined in plants with colonization by an ACC-deaminase-producing strain Enterobacter cloacae UW4 (Hontzeas et al., 2004). Up-regulation of genes involved in auxin responses and down-regulation of genes involved in ethylene responses were identified in plants colonized by another plant growth-promoting root colonizer, P. fluorescens FPT9601-T5 (Wang et al., 2005). Increases in defense and abiotic stress-related transcripts, and repression of photosynthesis-related transcript occurred with colonization by P. thivervalensis MLG45 (Cartieaux et al., 2003). Our previous work showed that the potential priming genes in A. thaliana upon root colonization by P. chlororaphis O6 were identified and characterized (Cho et al., 2011). Expression of the identified priming genes as well as jasmonic acid-and ethylene-regulated defense genes were predicted as important roles in the P. chlororaphis O6-mediated systemic tolerance against abiotic and biotic stresses (Cho et al., 2011).
For better understanding of the plant genes involved in stress tolerance induced by P. chlororaphis O6, in this study, we identified A. thaliana transcript changes using microarray approach in the leaves of plants treated with drought stress on the P. chlororaphis O6 root-colonized and non-colonized plants. We extended studies to examine the transcription of other plant defense genes that are associated with signaling pathways involving jasmonic acid, ethylene, and salicylic acid pathway under drought stress conditions.
Materials and Methods
Plant materials and growth conditions
Surface sterilized seeds of Arabidopsis thaliana ecotype Columbia (Col-0), were planted into sterile soil-less medium (peat moss: vermiculite: perlite, 7:3:3 v/v) using 500 cm3 of the medium in a 10.5 × 10.5 × 9 cm pot, and 15–30 seeds per pot. Arabidopsis plants were watered with 20 ml of sterile water per pot in every two days. Seedlings were grown with a 16-h-light/8-h-dark cycle under 40-W fluorescent lights (2,000 lux, 80 μmol photons m−2s−1). The temperature was maintained at 22 ± 1 °C with a relative humidity of 50–60%.
Bacterial strains and cultural condition
P. chlororaphis O6 was stored at −70 °C in 15% glycerol and prepared for experimental use as described previously (Cho et al., 2011). Briefly, frozen cells were streaked onto King’s medium B plates (KB) agar plates without antibiotics and incubated at 28 °C for 2 days. These cells were inoculated into KB broth without antibiotics and grown overnight. The cells were obtained as a pellet by centrifugation at 10,000 × g for 10 min, washed once with sterile water, and re-suspended to 1 × 10⁸ colony forming unit (cfu)/ml to use as an inoculum.
Induced drought tolerance bioassay
Arabidopsis plants were inoculated with bacterial suspension after two weeks of growth. Plants in pots were treated with 35 ml of the suspended P. chlororaphis O6 or water as control. Seven days after bacterial root treatment, one group of plants was stopped watering, whereas a second group was continued watering at two day intervals. At the defined days, the number of the survived seedling under drought stress was determined by determination of the percentages of recovery of the plants showing no wilt symptoms after rehydration. Three independent experiments were performed with at least 30 plants per treatment. Data were analyzed by one way ANOVA using SPSS Statistics v.19 (IBM Corporation, Somers, NY). The significance of treatments was determined by Duncan’s multiple range test (P < 0.05).
RNA isolation and gene chip microarray experiment
Arabidopsis plants were inoculated after two weeks of growth with P. chlororaphis O6 or water and incubated under drought or normal growth conditions as described above. At 15 day of drought, aerial parts of the plants were harvested, and frozen in liquid nitrogen for isolation of total RNA for gene chip analysis. Total RNA was prepared using RNeasy Plant Mini kits (Qiagen Inc., Valencia, CA) for microarray analysis. The quality of RNA was assessed by appearance of the bands after agarose gel electrophoresis and UV-absorbance spectrophotometry. For microarray analysis, total RNA was processed for use on Affymetrix Arabidopsis genome GeneChip arrays according to the manufacturer’s protocol (Santa Clara, CA). In brief, 10 μg of total RNA from each treatment used in a reverse transcription reaction to generate first-strand cDNA, using the SuperScript Choice System (Invitrogen, Carlsbad, CA) with oligo (dT)24 primer fused to T7 RNA polymerase promoter. After second strand synthesis, biotin-labeled target complementary RNA (cRNA) was prepared using the Bio-Array high-yield RNA transcript labeling kit (Enzo Biochem., New York, NY) in the presence of biotinylated UTP and CTP. After purification and fragmentation, 15 μg of cRNA was used in a 300 μl hybridization mixture containing added hybridization controls. A total of 200 μl of the mixture was hybridized on arrays for 16 h at 45 °C. Standard post-hybridization wash and double-stain protocols were used on an Affymetrix GeneChip fluidics station 450. Arrays were scanned on an Affymetrix GeneChip scanner 2500. The microarray study was duplicated with two independent RNA samples.
Affymetrix Gene Chip data analysis
The data were first analyzed with Microarray Suite 5.0 software (Affymetrix, Santa Clara, CA). For each microarray, overall intensity normalization for the entire probe sets was performed using Affymetrix Microarray Suite 5.0. Using the GeneChip Suite 5.0 default parameters, the detection of P-value (P < 0.05) and the signal value were calculated for each probe set from each independent sample hybridization. For the microarray analysis, overall intensity normalization for the entire probe set was performed as described (Irizarry et al., 2003), and then the signal value, which assigns a relative measure of abundance of the transcript, and the detection of P-value, which indicates whether a transcripts is reliably detected, were calculated for each probe set. The normalized data were examined by comparison of the ratio expression under the four conditions, control (non-colonized plants grown with normal watering), P. chlororaphis O6 root-colonized plants grown with normal watering, non-colonized plants grown with drought treatment and P. chlororaphis O6 root-colonized plants grown with drought treatment.
The change algorithm assigned a call of “increase” or “decrease”, when the signal log2 ratio was changed. The used signal log ratio cut-offs were corresponded to approximately a 2.0-fold change. In addition, the P-value, measuring the probability that the expression levels of each probe set are different between two arrays, was calculated for all comparison analyses that we performed. A probe set was designated as being up regulated, if the detection algorithm assigned a call of ‘present’ in the P. chlororaphis O6 treated sample and the signal log ratio was greater than or equal to 1.0 in both duplicated samples. A probe set was designated as being down regulated, if the detection algorithm assigned a call of ‘present’ in the P. chlororaphis O6 treated sample and the signal log ratio was less than or equal to – 1.0 in both duplicated samples.
We compared each array of each treatment and then normalized all of each comparison array for preprocessing applied by Robust Multiarray Average (RMA) methods (Irizarry et al., 2003). Genes preferentially expressed in the plants inoculated with P. chlororaphis O6 were identified using the same criterion, i) fold change cutoff > 2 and ii) significance level (T-test, 0.05) and iii) volcano plotting, showed both i and ii commonly significant probe sets, and iv) up-regulated and down-regulated gene probe sets were detected the algorithm assigned a call of ‘present’ by GCOS filtering.
Reverse transcription polymerase chain reaction (RT-PCR) analysis
Total RNA, isolated as described above, was used for RT-PCR to determine changes in transcript abundance for discrete genes. The plants for these studies were from different experiments than those used for the microarray analysis. RT-PCR with specific primer pairs (Supplemental Table 1) was performed using Reverse Transcription PCR kit (Qiagen Inc., Valentia, CA). Primers for the actin gene of A. thaliana, forward (5′-CATCAGGA AGGACTTGTACG-3′) and reverse (5′-GATGGACCTGA CTCGTC ATAC-3′), were used as an internal standard. The 25 μl reaction mixtures were incubated at 50 °C for 30 min for reverse transcription, followed by PCR for 35 cycles with denaturation at 94 °C for 15 s, annealing at 55 °C for 30 s, and extension at 72 °C for 30 s. A thermal cycler machine was used. Controls consisted of omission of one of the primers and analysis of the RNA without reverse transcription to determine that DNA was not present in the plant samples. The amplified PCR products were separated in 2% agarose gel stained with ethidium bromide. The results provided are typical of three independent studies.
Results
P. chlororaphis O6 induced drought tolerance phenotypes in Arabidopsis plant
Arabidopsis plants, in which water was withheld, showed reduction in survival after 14 days of drought. Survival rate rapidly decreased in control plants at 15 and 16 days of drought treatment. Plants inoculated with P. chlororaphis O6 did not show such a loss in viability upon water withholding (Fig. 1). Average populations of P. chlororaphis O6 was recovered from the roots of inoculated plants at about 3.5 × 10⁶ cfu/g of root, but no bacteria was recovered from roots of non-colonized control plants.
Drought tolerance in Arabidopsis thaliana is affected by root colonization with P. chlororaphis O6. Survival of A. thaliana cultivar Col-0 (n=30) was determined with plants grown in soilless medium for 2 weeks and inoculated with 108 cfu/ml of P. chlororaphis O6 (O6). After one week of growth under normal watering conditions (non-inoculated [C+W] and inoculated [O6+W]) plants were subjected to water withholding for a further 16 days (non-inoculated, [C+D] and inoculated [O6+D]). The survival rates of control plants grown under normal watering conditions were overlapped with those of O6 treated plants grown under normal watering conditions. Each data point represents the mean of three replicate experiments. Photographic images of plant appearance after drought stress or normal growth conditions for 16 days. Each data point represents the mean of three replicate experiments with 30 plants/treatement.
Analysis of gene expression by microchip array detection
A set of 5 representative control genes were identified that did not showed a significant change in expression under any of the treatments (Supplemental Table 2). The expression of five genes that are often regarded as having constitutive expression was examined for changes in expression induced by colonization with and without water withholding (Supplemental Table 2). Genes encoded for actin, glyceraldehyde phosphate dehydrogenase and ubiquitin did not show fold changes above 2 under the designated growth conditions. However, the 25S rRNA gene transcript was decreased in non-colonized and drought stressed plants compared to the control plants. There was increased transcript accumulation of 5S rRNA transcripts in P. chlororaphis O6 root-colonized plants grown with water withholding compared with the control plants (Supplemental Table 2).
Identification of genes preferentially expressed in plants colonized with P. chlororaphis O6
Our criteria to designate genes that were differentially expressed in leaves due to systemic affects induced by root colonization with P. chlororaphis O6 in plants grown under normal watering conditions were determined as described in method. The majority of P. chlororaphis O6-regulated genes were in the unknown function category, 53% for up-regulated genes and 34% for down regulated genes (Supplemented Fig. 1). Large differences between the up- and down-regulated were observed for genes involved in transcription and cellular transport. The up-regulated genes by root colonization of P. chlororaphis O6 were involved in plant growth promotion such as the auxin-induced genes (glucanase At4g30280, At1g56150, auxin responsive-family protein and the auxin efflux carrier protein (At2g17500) (Table 1). Genes involved in response to reactive oxygen species showed increased transcripts: glutaredoxin (At1g64500), glutathione S-transferase (At5g17220), peroxidase (At5g05340) and catalase (At4g35090). Genes encoding other stress-related proteins with increased transcripts included those induced by drought (At4g39070, At3g25780, and At5g43170), and a small protein (At4g02380), were also increased. Other increased transcripts were related to disease resistance included the PR protein (At5g57260), the broad spectrum mildew resistance gene RPW (At3g50480) and disease resistance proteins (At2g34930, At4g11180) (Table 1). Among the most expressed transcript was that for WRKY 18 involved in transcription of defense genes.
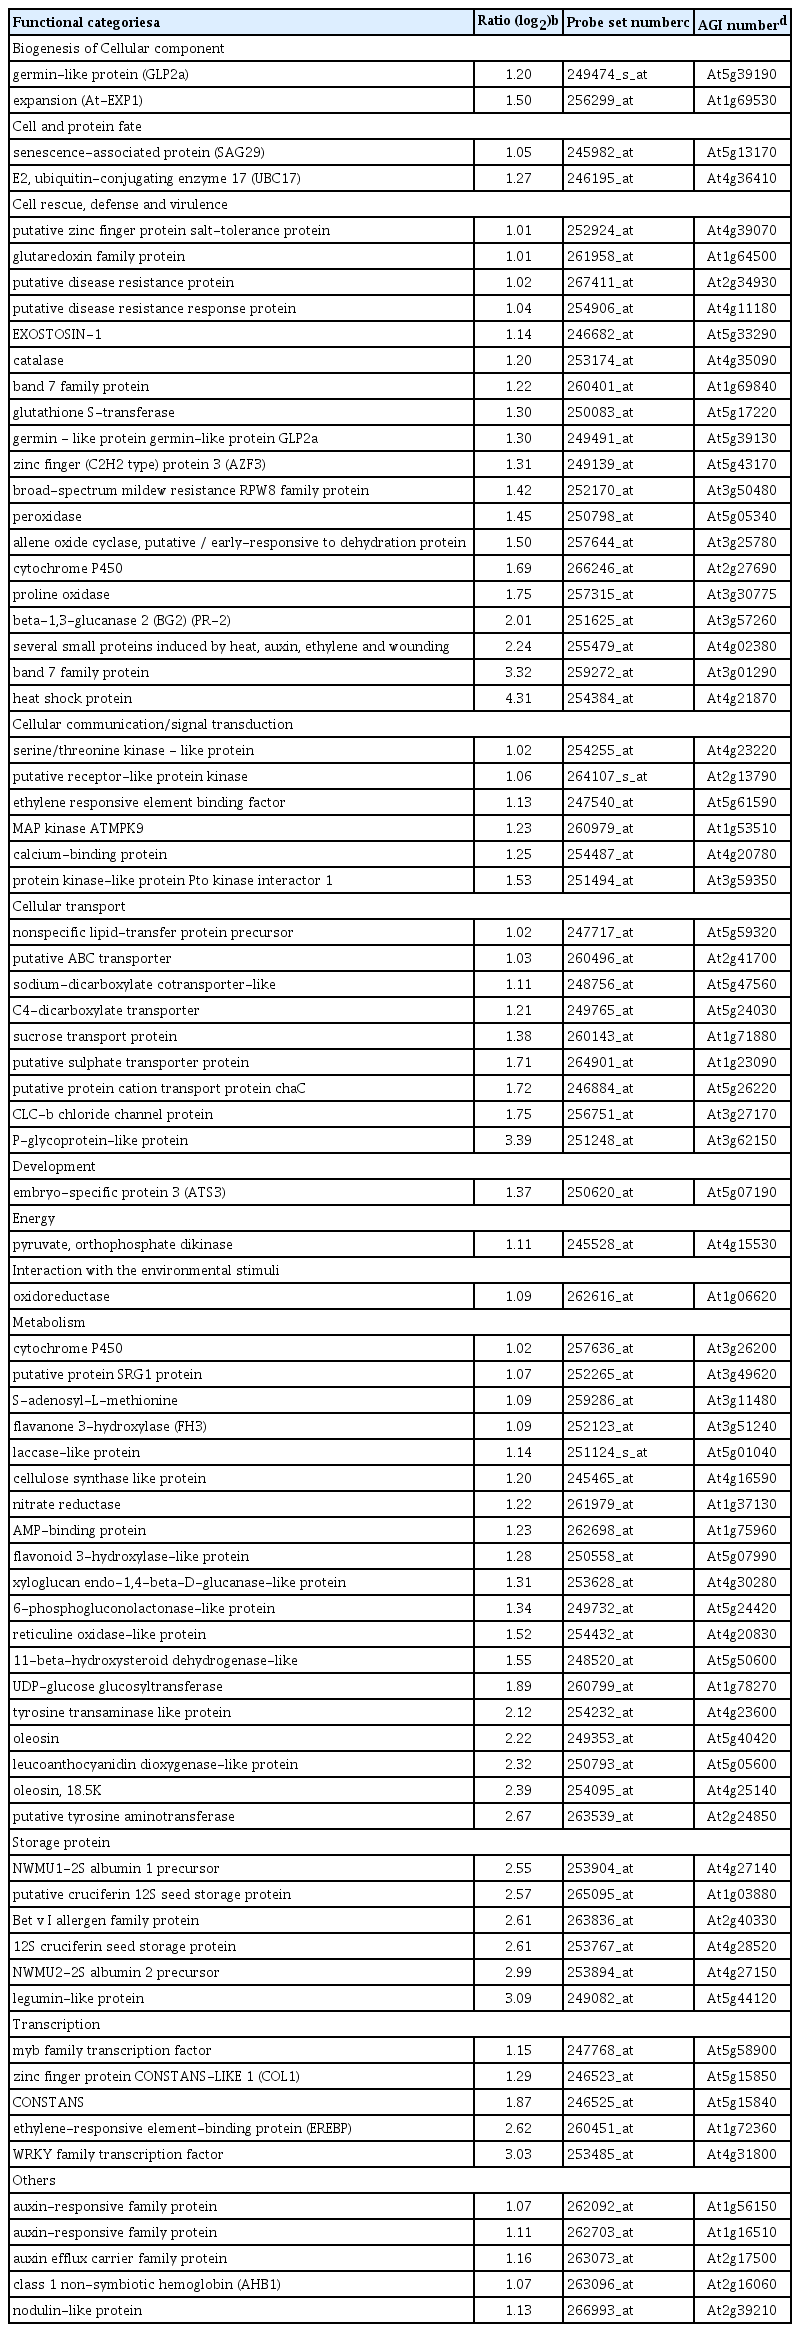
Genes with up-regulated transcripts in plants colonized with P. chlororaphis O6 grown under normal watering condition compared with genes in control plants grown under normal watering condition
Down-regulated genes upon P. chlororaphis O6 root-colonization were ABA- and ethylene-related: the ethylene transcription factors, ERF (At3g24500), Myb (At4g37260), Myc-like (At5g0415), and a negative regulator of ABA signaling, AB13 interacting protein At5g02810 (Table 2). Additionally, the transcript levels for three genes involved in salt and cold tolerance At1g06040, At2g42530, and At2g42540 were decreased.
Genes with down-regulated transcripts in plants colonized with P. chlororaphis O6 grown under normal watering condition compared with genes in control plants grown under normal watering condition
Genes preferentially expressed in P. chlororaphis O6-colonized and drought stressed plants
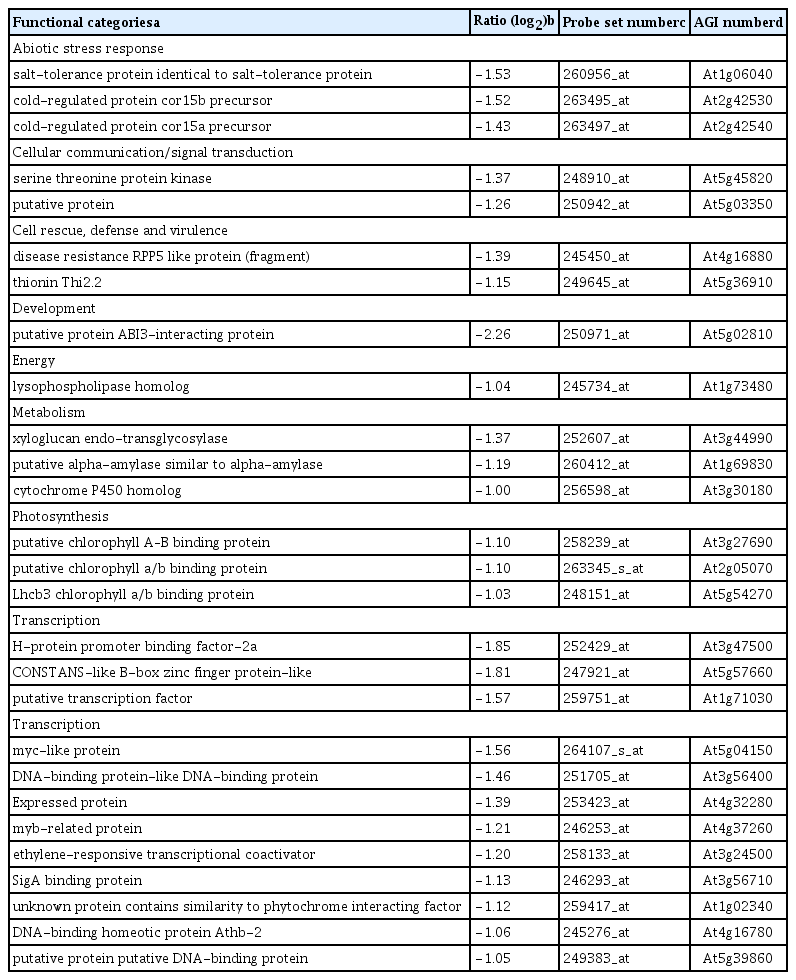
Up-regulated drought responsive genes in non-colonized drought stress treatment compared to normal watered control Arabidopsis plant were listed in Table 3. Transcripts of late embryogenesis abundant protein (At3g17520), low-temperature-responsive 65 kDa protein (At3g15670), Em-like protein GEA1 (At3g51810), putative dehydrin (At3g50980), and putative protein phosphatase 2C (At1g07430) were showed over 100 fold changes (Table 3).
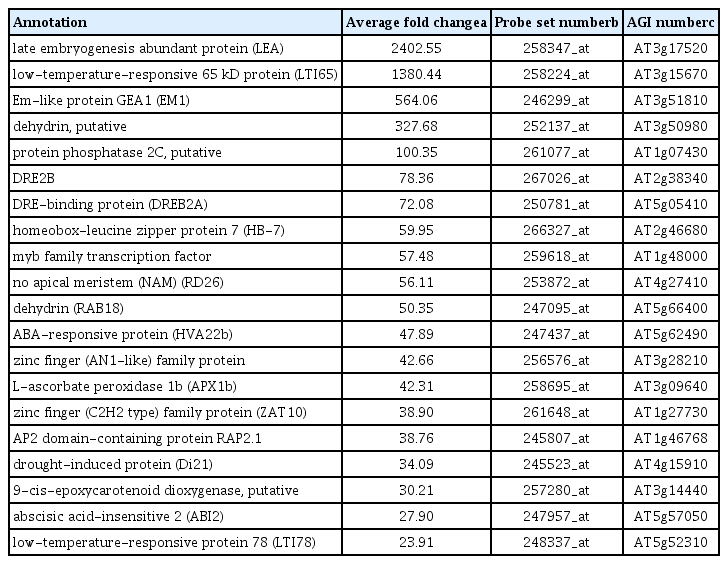
Representative up-regulated drought responsive genes in the control plant treated with stress compared with genes in control plants without drought treatment
Hierarchical clustering based on expression patterns in the plants colonized with P. chlororaphis O6 and treated drought stress showed that expression clusters I and II were up-regulated transcripts and cluster III and IV down-regulated genes (Fig. 2). Genes in cluster I or III were up- or down-regulated in the plants challenged with P. chlororaphis O6 compared to non-colonized control plants, whereas genes in cluster II or IV were up- or down-regulated in the P. chlororaphis O6 colonized and drought stressed plants compared to the drought stressed non-colonized plants. We focused on characterization of cluster II and cluster IV, because the genes were more changes in drought stress of P. chlororaphis O6-colonized plants than drought stress of non-inoculated plants.

Hierarchical cluster and expression pattern profiles of genes expressed differentially genes. Hierarchical cluster analysis of the 1919 differentially expressed genes. Up-regulated genes (red) cluster in sections I (211 genes) and II (797 genes) and down-regulated genes (green) in clusters III (299 genes) and IV 612 genes. The letters indicates comparison of expression profiles for each gene (t1c1 is commonly compare with O6 and control; t2c1 is commonly compare with O6 and drought treated plants versus control plants grown normal watering conditions; t2c2 is commonly compare with O6 and drought treated plants versus control plants treated with drought).
Clusters II and IV contained many genes that have no known function. However, genes with known function in cluster II and cluster IV are summarized in Supplemental Tables 3, 4, 5 and 6. Up-regulated genes in the cluster II were plant growth promotion auxin-induced genes (At1g78060, At3g13560, and At3g23730); genes related to elevated disease resistance include PR protein (At5g42100), anthranilate N-hydroxycinnamoyl/benzoyltransferase (At3g50270), genes related to carbon utilization (At1g70410, At5g14740) and stress response protein such glutathione-transferase like protein (At3g43800), salt stress induced proteins (At1g65860) (Tables 5 and 6); genes related to other metabolic pathway include glycolysis (At4g26530, At1g70820 and At1g56190), cell wall degrading genes (At1g60590, At4g22010, and At3g53190), sugar signaling (At5g66530), and gene of biosynthesis flavonoid (At1g65060) (Supplemental Table 3).
Some of the up-regulated genes in the cluster II involved in cellular communication; the calmodulin and calcium-binding protein (At3g52290, At2g41100, At3g49260, At5g07240, and At2g41090), receptor-like protein kinase (At5g67280, At5g61480, At5g16000, At4g34220, At5g16590, At5g01890, At3g49670, At2g36570, At3g56370, At3g14840 and At5g54380) protein phosphatase-2C (At4g38520), and serine-threonine-specific protein kinase (At5g59670) (Supplemental Table 4).
Down-regulated genes in the cluster IV were included; in metabolic pathway of plant growth related 3-ketoacyl-CoA thiolase (At2g33510); genes related to regulate carbon flux include acyl-CoA oxidase like protein (At4g167760), acyl-CoA oxidase 2 (At5g65110), and triacylglycerol lipase like protein (At5g18630); salt and drought stress induced proteins (At1g62570, At2g32090, and At5g11110), abiotic, biotic and senescence induced protein (At3g57520), sugar utilization related protein (At1g60140, At2g21590); genes related to other metabolic pathway include nitrogen metabolism (At5g11520), mitochondrial respiration related protein (At2g07687), phosphate starvation (At3g52780) (Supplemental Table 5).
The down-regulated genes in the cluster IV involve in cellular transcription; Myb transcription factors MYB94 (At3g47600), MYB43 (At5g16600), MYB102 (At4g21440), MYB74(At4g05100), cpm10 (At1g48000), and Myb related transcription factor (At5g04760), homeodomain transcription factor (At2g46680), ABA responsive AtHB-7 (At2g46680), AP2 domain transcription factor (At3g61630, At5g13330), CCAAT-box binding transcription factor (At1g54830, At1g72830), bZIP transcription factor (At2g46270, At3g62420, At3g49760), and Zinc finger ethylene-response transcription factor(At4g00940, At4g29190, At5g04340) (Supplemental Table 6).
RT-PCR confirmation of hybridization data from the microarray
To confirm the reliability of results from gene chip expression profile analyses, RT-PCR experiments were performed using cDNAs synthesized from total RNA from plants grown four different conditions. Expression of the representative genes in the cluster II: Thionin (At1g66100), PR5, myrosinase associated protein (At3g14210), and Ca2+ binding protein (At2g41090), was the highest levels in the O6 colonized and drought stressed plants, whereas expression of the five representative genes in the cluster IV, ABF3, ABI1, LEA3 (At4g02380), dehydrin (At3g50980), and alpha hydroxynitrile lyase (HNL4) (At5g10300), showed the highest expression in the non-colonized and drought-stressed plants (Fig. 3).
RT-PCR analyses of selected genes from cluster II and cluster IV from the microchip array analyses. RT-PCR was performed using total RNA isolated 15 days from plants that were non-inoculated and watered (C+W), water withheld for 15 days (C+D), inoculated with P. chlororaphis O6 and watered (O6+W), inoculated with P. chlororaphis O6 and water withheld for 15 days (O6+D). The genes examined were: thionin [At1g66100], PR5, myrosinase-associated protein [At3g14210], PP2C [At4g38520], CaBP-22 [At2g41090], and dehydration response protein ERD [At1g04430]), ABF3, ABI1, LEA3 [At4g02380], dehydrin [At3g50980], and HNL4 [At5g10300]. These results are the end points from 25 RT-PCR cycles and are typical of three independent studies.
Expression patterns of defense related genes
We extended our studies to examine the effects of the P. chlororaphis O6 root colonization and drought stress for defense-related genes associated with different signaling pathways: PR1 for the salicylic acid pathway, pdf1.2 and VSP1 for the jasmonate pathway and HEL for the ethylene pathway. Extension of the drought stress period for 13 and 15 days showed increasing transcript levels of VSP1 in the drought stressed plants, whereas the pdf1.2 transcript level was decreased in the plants under drought condition. However, the enhanced expression of the pdf1.2 and for HEL genes was detected in the O6-colonized plants grown under normal growth condition with normal watering. In drought stressed plants, the transcripts of the PR1, pdf1.2 and VSP1 were increased in the O6-treated plants under drought stress condition (Fig. 4).
Expression of plant disease resistance marker genes in P. chlororaphis O6-inoculated Arabidopsis thaliana Col-0. Transcript levels of designated genes in aerial parts of plants without roots were determined by RT-PCR. Expression levels in plants at 13 and 15 days of drought stress (D) with (O6) and without P. chlororaphis O6-inoculation (C) are shown. These results are the end points from 25 RT-PCR cycles and are typical of three independent studies.
Discussion
Plant is able to response and to survive drought stress depending on plant mechanism that integrates cellular responses (Kim et al., 2012). Plant drought tolerance can be achieved key genetical, biochemical and physiological changes. One of key hormones involved in the response of drought stress is the abscisic acid (ABA). The ABA regulates down-stream signal pathways involving in drought tolerance in plants (Shinozaki and Yamaguchi-Shinozaki, 1997). Our findings indicated that P. chlororaphis O6 root colonization induced abiotic stress (Cho et al., 2008; 2012) and induced resistance to pathogens (Kim et al., 2004; Ryu et al., 2007; Spencer et al., 2003). Priming effect by rhizobacteria has been associated with several types of induced resistance. The molecular mechanism of priming is still unclear. It is hypothesized that induction of the primed state results in an increase in the amount or activity of cellular components with important roles in defense signaling (Conrath et al., 2002). We believe the identified genes in this study will open opportunities for identification of novel plant genes or signal transduction pathways that are involved in induced drought tolerance by rhizobacteria.
We are intrigued by these studies to deduce the cell signaling pathways involved in the induced systemic tolerance by microbes. Our previous study with genes identified by differential expression approach in plants that were colonized for three days by P. chlororaphis O6, but were grown without water stress, confirmed a rapid induction of the auxin-related gene NIT1 (At3g44310) encoding nitrilase 1 (Cho et al., 2011).
In this study, at least five auxin-related genes were increased in P. chlororaphis O6 colonized plants. In the P. fluorescens FPT9601-T5 system, certain ethylene-pathway genes, the ethylene transcription factors, ERF (At3g24500), Myb (At4g37260) and Myc-like (At5g0415), were down-regulated. However, we observed up-regulation of drought- and salt-stress-related genes (At4g39070, At5g39130, At5g43170, and At3g25780). In this study, we confirmed that a concept in induced drought tolerance or induced systemic disease resistance in prior colonization of the plant by the rhizobacteria speed up the rate of transcript accumulation and increase transcript levels for the defense genes upon pathogen challenge or abiotic stresses. Normal grown plants under watering conditions for 13 days after inoculation with P. chlororaphis O6 showed increased transcript levels of the jasmonic acid-related genes, pdf1.2, and the ethylene responsive gene, hevein-like protein HEL supporting the data with other defense genes studied by Spencer et al. (2003). Other studies indicated that common defense and stress-response genes were beta-1,3-glucanase (PR-2), band 7 family protein (At3g01290), and UDP-glucose transferase (At1g78270). In Arabidopsis plants, induced systemic resistance by root colonization with P. fluorescens W417r was correlated with induction of plant defense related genes (Verhagen et al., 2004). Several defense responsive genes are induced response to abiotic stress such as salt and drought stress (Mayak et al., 2004; Timmusk and Wagner, 1999). Pepper endochitinase gene over-expressing transgenic plants show bacterial infection disease resistance as well as exhibit increase tolerance to NaCl during germination and seedling growth (Hong and Hwang, 2006). Other defense responsive gene, pepper basic PR1 gene promoter activated not only defense response material such as bacterial pathogen, ethylene, salicylic acid but also high salt, drought, and low temperature (Hong et al., 2005). These results indicated that up-regulation of the identified genes related to plant defense related genes might be correlated in the induced systemic tolerance or resistance against plant diseases and abiotic stresses by root colonization of P. chlororaphis O6.
Our RT-PCR results confirmed the finding that P. chlororaphis O6 induces systemic activation of plant defenses under drought stress condition. The genes include thionin, PR5 and myrosinase associated protein were belonged in the cluster II. Thionins, 5 kDa, basic, cysteine-rich anti-microbial peptides, have been identified in a large number of plant species, and are either expressed constitutively or induced by pathogen attack or elicitors (Epple et al., 1997, 1998; Fernandez de Caleya et al., 1972). PR5 proteins are also called thaumatin-like proteins because of their striking sequence similarity with thaumatin, a sweet-tasting protein from Thaumatococcus daniellii (Cornelissen et al., 1986; Edens et al., 1982; Pierpoint et al., 1990). Although the biological function of thaumatin-like proteins has not yet been established, members of this group have been shown to have antifungal activity against a broad spectrum of fungal pathogens (Hajgaard et al., 1991; Vigers et al., 1992). Myrosinases may be involved in plant defense in the damaged plant tissues by insects or microorganisms, because they involve in releasing toxic glucosinolates (Wittstock et al., 2002).
Five genes exhibiting decrease expression in cluster IV tested are including ABF3, ABI1, LEA3, dehydrin and HNL4. This cluster IV is very interesting, because ABF3, ABI1 and dehydrin are known to representative drought signaling response gene. Constitutive over-expression of the binding factors ABF3, which is regulated through the ABA-responsive elements (ABRE), induced drought tolerance in Arabidopsis (Choi et al., 2000). We believe that the root colonization by P. chlororaphis O6 reduces the drought stress phenotypes, thus alleviating the need to express drought signaling response genes in the protected plants. Our findings using Arabidopsis mutants altered in cell signaling pathways also suggested that ABA is not the major player in drought tolerance induced by P. chlororaphis O6, rather jasmonic acid might be involved (Cho et al., 2011; 2012).
In summary, we observed that root colonization by P. chlororaphis O6 stimulated genes responsive to drought as well those genes with defense roles. It is interesting that resilience to both abiotic stress and to biotic challenge is simultaneously activated by interaction with certain rhizo-sphere microbial colonizers. We speculate that induced drought resistance by O6 could be resulted of priming effect by unknown microbial determinants produced by this bacterium and resulted of activation of complex signal network mediating by plant hormones, and plant defense resistance might be played an important role in induced systemic tolerance against abiotic stresses.
Acknowledgments
This work was supported by a grant from BioGreen 21 program (code# 2007041034005), Rural Development Administration and by Basic Science Research Program through the National Research Foundation of Korea (NRF) funded by the Ministry of Education, Science and Technology (2011-0011555).